

The liver, from segments and sinusoids to drug metabolism and liver injury
How the liver is built, what it makes and clears, which enzymes and transporters handle drugs and plant compounds, how liver tests are read, and how clinicians and regulators judge whether a drug or supplement injured the liver. Each value is tied to the source it came from.
Vernon H, et al. StatPearls, Liver anatomy, updated Nov 26, 2022; Hundt M, et al. StatPearls, Bile secretion, updated Sep 26, 2022; Rendic S, Guengerich FP. Chem Res Toxicol 2015;28:38–42; Navarro VJ, et al. Hepatology 2014;60:1399–1408.
Status. Education, not medical advice. EUTECNIQ is in formation and runs no laboratory, clinical service or studies. Figures marked as calculations are educational calculations from published thresholds, not measurements or predictions for any product or person.
Related: ADME, PK and PBPK (first pass, extraction ratio, PBPK structure, midazolam interaction data) · Risk assessment · Contaminants · Supplement–drug interactions
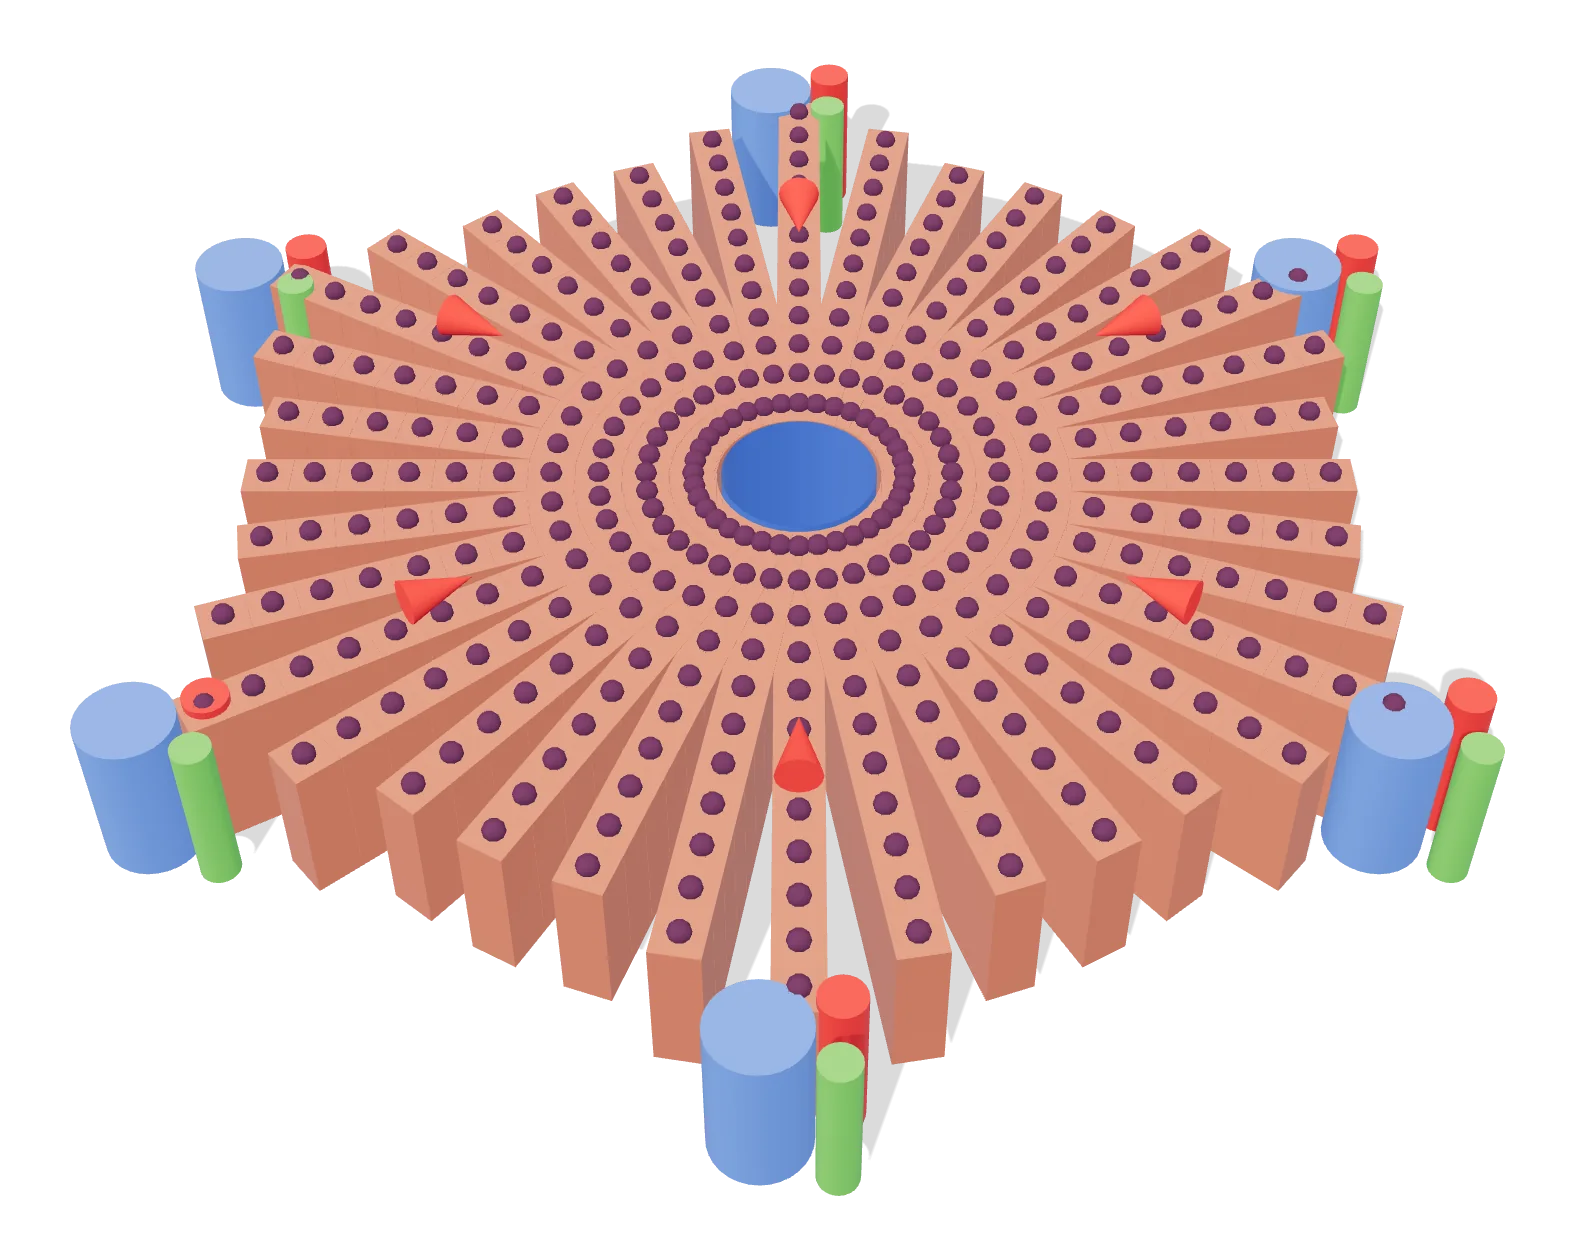
- 1 Central vein drains to the hepatic veins
- 2 Portal triad: portal vein, hepatic artery, bile duct
- 3 Plates of hepatocytes; blood flows toward the center
Rendered by EUTECNIQ; generalized and not to scale.
Eight segments, set by blood supply, divide a liver that looks like four lobes
The liver sits under the diaphragm in the right upper abdomen. On its surface it shows four lobes: right, left, caudate and quadrate. The falciform ligament divides it into anatomic right and left along the front, and its free edge carries the round ligament, the remnant of the fetal umbilical vein.
Surgeons and radiologists use a different map. The Couinaud classification divides the liver into eight functionally independent segments, each a wedge with its apex at the hilum. A single branch of the hepatic artery, portal vein and bile duct enters each segment, and the hepatic veins run between segments to the inferior vena cava.
On the functional map, the middle hepatic vein, running from the gallbladder fossa to the vena cava, separates right from left liver; the falciform ligament separates the medial and lateral parts of the left lobe.
Text version: the eight segments and what bounds them
| Segment | Part of the liver | Bounded by |
|---|---|---|
| I | Caudate lobe, on the posterior surface | Can receive blood from both right and left portal vein; drains directly into the inferior vena cava (imaging chapter; the anatomy chapter says it drains into the middle hepatic vein in most people) |
| II | Left lobe, lateral, upper | Falciform ligament (medially); portal plane (below) |
| III | Left lobe, lateral, lower | Falciform ligament (medially); portal plane (above) |
| IV | Left lobe, medial | Middle hepatic vein (right side); falciform ligament (left side) |
| V | Right lobe, anterior, lower | Middle and right hepatic veins; portal plane (above) |
| VI | Right lobe, posterior, lower | Right hepatic vein; portal plane (above) |
| VII | Right lobe, posterior, upper | Right hepatic vein; portal plane (below) |
| VIII | Right lobe, anterior, upper | Middle and right hepatic veins; portal plane (below) |
Azizaddini S, Tafti D, Mani N. Diagnostic Imaging of the Liver. StatPearls, updated Feb 20, 2023: "The middle hepatic vein runs from the inferior vena cava to the gallbladder fossa and divides the liver into the right and left lobes. The right hepatic vein divides the right lobe into the anterior and posterior segments, and the falciform ligament divides the left lobe into medial and lateral segments. The portal vein divides segments horizontally into superior and inferior segments." Segments II, III and IV form the left lobe, V to VIII the right; the segments are numbered clockwise (Prater S, Zayas JO, StatPearls, updated May 22, 2023). Within the lateral left lobe, segment II is posterior-superior and segment III anterior-inferior, separated by the plane through the portal vein bifurcation (Sharma M, Somani P, Rameshbabu CS, et al. Stepwise evaluation of liver sectors and liver segments by endoscopic ultrasound. World J Gastrointest Endosc 2018;10:326–339).
| Structure | What the source states | Source |
|---|---|---|
| Dual blood supply | 75% to 80% of blood volume from the portal vein, 20% to 25% from the hepatic artery | StatPearls, Liver anatomy (2022) |
| Oxygen | The portal vein provides 75% of the liver's blood supply but 50% of its oxygen supply | StatPearls, Diagnostic imaging (2023) |
| Portal vein | Formed by the superior mesenteric and splenic veins behind the neck of the pancreas; runs with the proper hepatic artery and common bile duct in the hepatoduodenal ligament | StatPearls, Liver anatomy |
| Hepatic veins | Right 39.6%, middle 32.7%, left 20.7% of venous drainage; the caudate lobe drains to the middle hepatic vein in most people, sometimes straight into the vena cava | StatPearls, Liver anatomy |
| Bile ducts | Right and left hepatic ducts join as the common hepatic duct; with the cystic duct from the gallbladder it forms the common bile duct, which enters the duodenum at the ampulla of Vater. The left hepatic duct drains segments II, III and IV | StatPearls, Biliary ducts (2023) |
| Countercurrent flow | In each portal triad bile leaves while portal and arterial blood arrive, a countercurrent that the source links to exchange of electrolytes and bile acids | StatPearls, Liver anatomy |
Vernon H, Wehrle CJ, Alia VSK, Kasi A. Anatomy, Abdomen and Pelvis: Liver. StatPearls, updated Nov 26, 2022; Azizaddini S, et al. StatPearls, 2023; Hundt M, Wu CY, Young M. Anatomy, Abdomen and Pelvis: Biliary Ducts. StatPearls, updated Jul 15, 2023. The three hepatic-vein shares add to 93% as published. Liver blood flow as a share of cardiac output in the ICRP reference adult (25.5%) is on ADME, PK and PBPK.
Blood runs from the portal triads to the central vein, and bile runs the other way
Hepatocytes form plates around a central vein in a roughly hexagonal lobule, with a portal triad at each corner: a portal-vein branch, a hepatic-artery branch and a bile duct. The blood of both vessels mixes in the sinusoids, the capillaries between the plates, and drains to the central vein, a branch of the hepatic vein.
The portal acinus describes the same tissue by blood flow. It is the rhombus between two portal triads and the two central veins they face. Zone 1 lies next to the triads, zone 3 around the central veins and zone 2 between them. Oxygen falls along this path, which is one reason the zones do different work.
Show data: oxygen tension along the acinus
| Compartment | Periportal (zone 1) | Perivenous (zone 3) |
|---|---|---|
| Blood | 60–65 mm Hg (84–91 µmol/L) | 30–35 mm Hg (42–49 µmol/L) |
| Hepatocytes (intracellular) | 45–50 mm Hg | 15–20 mm Hg |
Kietzmann T. Metabolic zonation of the liver: the oxygen gradient revisited. Redox Biol 2017;11:622–630, section 3.
| Structure | What it is and does | Numbers |
|---|---|---|
| Sinusoidal endothelial cells | Line the sinusoid; holes (fenestrae) grouped in sieve plates let fluid, solutes and particles smaller than the holes reach the space of Disse | Human liver without pathology: fenestra diameter 107 ± 1.5 nm. Review figure for scanning EM in general: 150–175 nm, 9–13 per µm², 6–8% of the surface, with porosity rising from 6% periportal to 8% centrilobular |
| Space of Disse | Gap between endothelium and hepatocytes, filled with hepatocyte microvilli and extracellular matrix; hepatocytes have no true basement membrane | — |
| Stellate (Ito) cells | Sit in the space of Disse and store vitamin A in lipid droplets; when activated by injury they lose the droplets, and they secrete TGF-β in cirrhosis | Most of the body's retinoid is held in these droplets |
| Kupffer cells | Resident macrophages found in the sinusoid | — |
| Bile canaliculi | Channels formed by the apical membranes of neighboring hepatocytes; they make a "chicken-wire" lattice and carry bile toward the portal triad | The canalicular membrane is about 1% of the hepatocyte surface |
| Chylomicron remnants | Must pass the fenestrae to reach hepatocytes | Mean diameter 90–250 nm |
Braet F, Wisse E. Comp Hepatol 2002;1:1 (sieve plates, scanning EM values, remnants); Wisse E, Jacobs F, Topal B, Frederik P, De Geest B. Gene Ther 2008;15:1193–1199; Blaner WS, et al. Biochim Biophys Acta 2009;1791:467–473; Kietzmann 2017; Kalra A, et al. StatPearls, Physiology, Liver, updated May 1, 2023; Hundt M, et al. StatPearls, Bile secretion, 2022.
Zone 3 receives the least oxygen and, in this human study, carries more CYP1A2, CYP3A4, CYP2C19 and CYP2E1 mRNA than zone 1.
Explanation, details and sources
Zonation separates opposing pathways and is not fixed: its pattern changes with nutrition, drugs and hormones, and even glutamine synthetase, long treated as static, can extend under thyroid hormone or R-spondin signals (Kietzmann 2017). In the human study, zone 1 enrichment of serine dehydratase (SDS) and glutaminase 2 (GLS2) and zone 3 enrichment of glutamine synthetase (GLUL) and the ammonium transporter RHBG led the authors to conclude that zone 1 specializes in urea production while zone 3 uses ammonia to make glutamine, as in mice. StatPearls places the biotransformation of drugs mainly in zone 3. Germander injury, for example, shows prominent centrilobular necrosis on biopsy (LiverTox).
| Gene | Encodes | Higher in | Fold change |
|---|---|---|---|
| HAL | Histidine ammonia-lyase | Zone 1 | 29.12 |
| GLS2 | Glutaminase 2 | Zone 1 | 19.87 |
| SDS | Serine dehydratase | Zone 1 | 11.50 |
| CYP2A7 | Cytochrome P450 2A7 | Zone 1 | 9.00 |
| RHBG | Rh family B glycoprotein | Zone 3 | 37.93 |
| CYP1A2 | Cytochrome P450 1A2 | Zone 3 | 13.58 |
| SLCO1B3 | OATP1B3 uptake transporter | Zone 3 | 12.80 |
| CYP3A4 | Cytochrome P450 3A4 | Zone 3 | 11.00 |
| CYP2C19 | Cytochrome P450 2C19 | Zone 3 | 9.88 |
| GLUL | Glutamine synthetase (glutamate-ammonia ligase) | Zone 3 | 8.91 |
| UGT1A3 | UDP-glucuronosyltransferase 1A3 | Zone 3 | 4.02 |
| CYP2E1 | Cytochrome P450 2E1 | Zone 3 | 3.67 |
McEnerney L, Duncan K, Bang BR, et al. Dual modulation of human hepatic zonation via canonical and non-canonical Wnt pathways. Exp Mol Med 2017;49:e413 (RNA-seq data GSE83990); Kietzmann 2017; Vernon H, et al. StatPearls 2022; LiverTox, Germander, updated Mar 12, 2018. UniProt lists OATP1B1 and OATP1B3 at the basolateral membrane of hepatocytes near the central vein.
One organ makes plasma proteins and bile, stores vitamins and clears heme
The liver makes up around 2% of adult body weight. It is both exocrine, secreting bile, and endocrine, taking part in glucose control with insulin and glucagon.
| Function | What happens | Published numbers | Source |
|---|---|---|---|
| Protein synthesis | Makes nearly every plasma protein, including albumin, binding globulins, protein C, protein S and every clotting factor except factor VIII. Factors II, VII, IX and X and proteins C and S need vitamin K for γ-carboxylation | Albumin: 10–15 g a day | StatPearls, Physiology, Liver; Physiology, Albumin (updated Jan 31, 2026) |
| Bile | Hepatocytes secrete bile acids, cholesterol, phospholipid and bilirubin into the canaliculi; bile is stored and concentrated in the gallbladder; most bile acids return from the ileum to the liver | ≈600 mL a day (75% hepatocytes, 25% cholangiocytes); about 225 mL a day of the hepatocyte part is bile-salt-dependent; about 5% of bile acids are excreted | StatPearls, Bile secretion (2022) |
| Bile-acid synthesis | P450 oxidation of cholesterol; cholesterol 7α-hydroxylase (CYP7A1) is the rate-limiting step | This classic pathway is 95% of bile-acid synthesis | StatPearls, Physiology, Bile Acids (2023) |
| Heme and bilirubin | Takes up albumin-bound unconjugated bilirubin, conjugates it with glucuronic acid (UGT1A1) and secretes it into bile | About 4 mg/kg of bilirubin is produced daily, roughly 80% from hemoglobin of old red cells | StatPearls, Physiology, Bilirubin (2022); Physiology, Liver |
| Carbohydrate | Stores glycogen, at the highest concentration per gram of any tissue; glucose-6-phosphatase lets it release free glucose into the blood; makes glucose by gluconeogenesis | — | StatPearls, Biochemistry, Glycogen (2026); Liver anatomy |
| Nitrogen | Converts ammonia to urea; zone 3 hepatocytes also fix ammonia as glutamine | — | StatPearls, Liver anatomy; McEnerney 2017 |
| Storage and activation | Stores vitamin A (in stellate cells), iron and copper; 25-hydroxylates vitamin D by P450; deiodinates T4 to T3 | — | StatPearls, Physiology, Liver |
| Clearance of foreign compounds | Turns lipophilic compounds into water-soluble ones by phase I and phase II reactions, mostly in the smooth endoplasmic reticulum, then moves them into bile or blood | See the next three sections | StatPearls, Physiology, Liver |
Kalra A, Yetiskul E, Wehrle CJ, Tuma F. Physiology, Liver. StatPearls, updated May 1, 2023; Moman RN, et al. Physiology, Albumin, updated Jan 31, 2026; Hundt M, Basit H, John S. Physiology, Bile Secretion, updated Sep 26, 2022; Chen I, Cassaro S. Physiology, Bile Acids, updated May 1, 2023; Kalakonda A, et al. Physiology, Bilirubin, updated Sep 12, 2022; Daghlas SA, Rahimi N. Biochemistry, Glycogen, updated Mar 21, 2026 (all NCBI Bookshelf).
Five P450s carry most drug oxidation, and CYP3A4 the largest share
Cytochrome P450 enzymes (CYPs; EC 1.14.14.1) insert one oxygen atom from O2 into a substrate and reduce the other to water, using electrons from NADPH. Of 57 putatively functional human CYPs, about a dozen in families 1, 2 and 3 handle most foreign compounds, including 70–80% of drugs in clinical use. The basics of first-pass metabolism and the extraction ratio are on ADME, PK and PBPK.
For natural and physiological compounds, 29% of reported P450 reactions fall outside the twelve P450s listed, against 6% for drugs.
Explanation, details and sources
The highest-expressed liver P450s are CYP3A4, 2C9, 2C8, 2E1 and 1A2; 2A6, 2D6, 2B6, 2C19 and 3A5 are less abundant, and 2J2, 1A1 and 1B1 are mainly extrahepatic (Zanger and Schwab 2013). Earlier analyses of the 200 most prescribed drugs found that about 75% are cleared mainly by P450s, about 90% of P450 reactions belong to CYP1A2, 2C9, 2C19, 2D6 and 3A4, and about 46% to CYP3A enzymes (as summarized by Rendic and Guengerich). StatPearls gives CYP2D6 and CYP3A4/5 roles in about 20% and 30% of clinically used drugs.
The authors' caveats: the analysis covers only oxidation and reduction; counts reflect the compounds studied most; listing an enzyme does not give its share of clearance; CYP3A4 and 3A5 overlap; and the fractions may change as orphan P450s are characterized.
| P450 | Drugs, % | Natural and physiological compounds, % |
|---|---|---|
| CYP3A4 | 27 | 15 |
| CYP2D6 | 13 | 6 |
| CYP2C9 | 10 | 8 |
| CYP2C19 | 9 | 6 |
| CYP1A2 | 9 | 8 |
| CYP3A5 | 6 | 3 |
| CYP1A1 | 5 | 7 |
| CYP2C8 | 5 | 3 |
| CYP2B6 | 4 | 3 |
| CYP2E1 | 3 | 4 |
| CYP2A6 | 2 | 4 |
| CYP1B1 | 1 | 4 |
| Other P450s | 6 | 29 |
Rendic S, Guengerich FP. Survey of human oxidoreductases and cytochrome P450 enzymes involved in the metabolism of xenobiotic and natural chemicals. Chem Res Toxicol 2015;28:38–42; Zanger UM, Schwab M. Pharmacol Ther 2013;138:103–141 (abstract); Patel T, Rahimi N, Cassagnol M. Biochemistry, Cytochrome P450. StatPearls, updated Jan 10, 2026; UniProt P11712, P05177 (EC numbers).
Flavin monooxygenases, amine oxidases, dehydrogenases and esterases handle much of the rest
In the same survey, P450s catalyzed about 96% of drug oxidation and reduction reactions; FMO, monoamine oxidase and aldo-keto reductases shared the remainder. Outside oxidation and reduction, UDP-glucuronosyltransferases and esterases were the main non-P450 enzymes in an earlier analysis of drugs.
| Enzyme (gene, EC) | Reaction | Where in the cell | Notes from the sources |
|---|---|---|---|
| Flavin-containing monooxygenase 3 (FMO3; EC 1.14.13.8) | Oxygenation of nitrogen- and sulfur-containing drugs and dietary compounds | Endoplasmic reticulum (microsomes); liver | FMO: about 2% of drug oxidation–reduction reactions |
| Monoamine oxidase A and B (MAOA, MAOB; EC 1.4.3.4) | Oxidative deamination of amines, including neurotransmitters and exogenous amines | Outer mitochondrial membrane | MAO: about 1% of drug oxidation–reduction reactions |
| Aldo-keto reductases (AKR) | NADPH-dependent reduction of carbonyl compounds to alcohols (AKR1B1 as example) | — | About 1% for drugs, about 4% for natural and physiological compounds |
| Aldehyde oxidase (AOX1; EC 1.2.3.1) | Oxidation of a broad range of drug and xenobiotic substrates | Cytoplasm; abundant in liver | — |
| Alcohol and aldehyde dehydrogenases (ADH, ALDH2) | ADH and ALDH are the primary enzymes of alcohol metabolism; ALDH2 oxidizes acetaldehyde derived from ethanol | ADH cytoplasm; ALDH2 mitochondria | An inactive ALDH2 form, common in Asian populations, impairs acetaldehyde metabolism and causes flushing, nausea and vomiting |
| Carboxylesterases (CES1, CES2) | Hydrolysis of esters; activation of ester and amide prodrugs | Endoplasmic reticulum lumen | CES1 mainly in liver; CES2 mainly in the small intestine, with moderate liver expression |
| Microsomal epoxide hydrolase (EPHX1; EC 3.3.2.9) | Adds water to reactive epoxides, giving less reactive dihydrodiols | Endoplasmic reticulum | — |
Rendic and Guengerich 2015 (shares, Table 1, and the earlier analysis by Williams et al. that they cite); UniProt entries P31513 (FMO3), P27338 (MAOB), Q06278 (AOX1), P00325 (ADH1B), P05091 (ALDH2), P23141 (CES1), O00748 (CES2), P07099 (EPHX1), P15121 (AKR1B1), accessed Oct 29, 2026; Wen AG, et al. Pharmacogenomics Overview, StatPearls (ADH and ALDH).
Conjugation makes a molecule more water-soluble for secretion into bile or blood
Phase II enzymes join a drug or its phase I metabolite to glucuronic acid, sulfate, glutathione, an acetyl or a methyl group. Glucuronidation happens in the endoplasmic reticulum; sulfation and most glutathione conjugation happen in the cytosol. When reduced glutathione is used up, toxic metabolites can build up, as in acetaminophen overdose.
| Family (example, EC) | Group transferred (donor) | Where | Typical substrates and variants |
|---|---|---|---|
| UDP-glucuronosyltransferases (UGT1A1; EC 2.4.1.17) | Glucuronic acid (UDP-glucuronic acid) | Endoplasmic reticulum; liver, colon, small intestine | Bilirubin, steroids, thyroid hormones, morphine, acetaminophen. Reduced UGT1A1 activity causes the mild hyperbilirubinemia of Gilbert syndrome; UGT1A1*28/*28 impairs conjugation of SN-38, which links UGT1A1 to irinotecan toxicity |
| Sulfotransferases (SULT1A1; EC 2.8.2.1) | Sulfonate (PAPS) | Cytosol; liver, lung, adrenal, brain, platelets, skin | Molecules with a hydroxyl or amine group |
| Glutathione S-transferases (GSTA1, GSTM1; EC 2.5.1.18) | Glutathione | Cytosol (a minority of conjugation in mitochondria) | Electrophilic compounds |
| N-acetyltransferases (NAT1, NAT2; EC 2.3.1.5) | Acetyl (acetyl-CoA) | Cytosol | Hydrazine and arylamine drugs such as isoniazid; NAT2 genotype separates rapid, intermediate and poor (slow) acetylators |
| Catechol O-methyltransferase (COMT; EC 2.1.1.6) | Methyl (S-adenosylmethionine) | Cytosol and membrane; brain, liver, placenta, blood cells | Catecholamines, catechol hormones, L-DOPA, α-methyldopa |
| Thiopurine S-methyltransferase (TPMT; EC 2.1.1.67) | Methyl (S-adenosylmethionine) | Cytosol | Azathioprine, mercaptopurine, thioguanine. Low-activity variants raise the risk of myelosuppression; CPIC estimates 0.2% of Europeans are poor metabolizers and 8.7% intermediate |
Kalra A, et al. StatPearls, Physiology, Liver (2023); Wen AG, Wen S, Patel P. Pharmacogenomics Overview. StatPearls (NBK617055); UniProt P22309, P50225, P08263, P09488, P18440, P11245, P21964, P51580, accessed Oct 29, 2026; CPIC TPMT frequency table (file of Oct 2026) and Relling MV, et al. Clin Pharmacol Ther 2019;105:1095–1105.
Transporters decide what enters the hepatocyte and which way metabolites leave
The hepatocyte is polarized. Its basolateral (sinusoidal) membrane faces the blood and carries uptake carriers of the solute carrier (SLC) family; its canalicular membrane faces bile and carries ATP-binding cassette (ABC) pumps that secrete against a concentration gradient. Some authors call this transport step phase III.
| Transporter (gene) | Membrane | Moves | Documented relevance |
|---|---|---|---|
| NTCP (SLC10A1) | Basolateral | Conjugated bile acids into the cell, driven by the sodium gradient | — |
| OATP1B1 (SLCO1B1) | Basolateral, centrilobular hepatocytes | Organic anions into the cell | Decreased-function variants raise exposure to most statins and can lead to myopathy; the review notes that the flavonoid quercetin inhibits OATP1B1-mediated statin transport, while increases in pravastatin exposure with quercetin in healthy participants were modest |
| OATP1B3 (SLCO1B3) | Basolateral, near the central vein | Organic anions into the cell | Listed with OATP1B1 among transporters to evaluate for drug interactions (ICH M12) |
| OCT1 (SLC22A1) | Basolateral | Organic cations into the cell | EMA guidance asks sponsors to consider OCT1 inhibition |
| MRP3 (ABCC3) | Basolateral | Conjugates back to the blood | Higher plasma glucuronides in NASH are consistent with less MRP2 and more MRP3 efflux |
| BSEP (ABCB11) | Canalicular | Bile salts into bile | Inherited defects cause PFIC type 2; inhibition by drugs is associated with cholestasis and drug-induced liver injury |
| MDR3 (ABCB4) | Canalicular | Phospholipid into bile | Inherited defects cause PFIC type 3 |
| MRP2 (ABCC2) | Canalicular (apical) | Multispecific organic anions, including conjugates | — |
| P-glycoprotein, MDR1 (ABCB1) | Canalicular (apical) | Drugs out of the cell | Inducible through PXR, the receptor that also regulates CYP3A4; St John's wort raised duodenal P-gp 1.4-fold in men |
| BCRP (ABCG2) | Apical | Drugs and conjugates | Listed among transporters to evaluate for drug interactions (ICH M12) |
Galetin A, Brouwer KLR, Tweedie D, et al. Membrane transporters in drug development and as determinants of precision medicine. Nat Rev Drug Discov 2024;23:255–280 (PMC11464068); ICH M12 Drug Interaction Studies, Step 4, May 21, 2024; UniProt subcellular-location entries (accessed Oct 29, 2026); Hundt M, et al. StatPearls, Bile secretion; Kalra A, et al. StatPearls, Physiology, Liver; Dürr D, et al. Clin Pharmacol Ther 2000;68:598–604. The transporter roster for intestine and blood–brain barrier is on ADME, PK and PBPK.
Inherited variants make one person a poor metabolizer and another ultrarapid
CPIC, the Clinical Pharmacogenetics Implementation Consortium, translates genotypes into metabolizer phenotypes. For CYP2D6 each allele gets an activity value; the sum is the activity score: 0 is a poor metabolizer, above 0 and below 1.25 intermediate, 1.25 to 2.25 normal and above 2.25 ultrarapid; an allele carrying several copies of a functional gene has its value multiplied by the copy number.
Show data: phenotype frequencies, %
| Gene and group | Poor | Intermediate | Normal | Rapid | Ultrarapid | Indeterminate |
|---|---|---|---|---|---|---|
| CYP2D6, African American/Afro-Caribbean | 2.3 | 35.9 | 53.8 | — | 4.1 | 3.9 |
| CYP2D6, American | 2.0 | 23.4 | 66.9 | — | 5.2 | 2.5 |
| CYP2D6, Central/South Asian | 2.4 | 28.1 | 58.1 | — | 1.5 | 10.0 |
| CYP2D6, East Asian | 0.8 | 38.5 | 53.2 | — | 0.9 | 6.7 |
| CYP2D6, European | 6.5 | 38.3 | 49.2 | — | 2.3 | 3.7 |
| CYP2D6, Latino | 3.1 | 29.1 | 59.6 | — | 4.1 | 4.2 |
| CYP2D6, Near Eastern | 2.2 | 30.1 | 56.5 | — | 7.4 | 3.7 |
| CYP2D6, Oceanian | 0.3 | 9.5 | 63.6 | — | 17.8 | 8.7 |
| CYP2D6, Sub-Saharan African | 2.0 | 38.1 | 46.4 | — | 4.5 | 9.0 |
| CYP2C19, African American/Afro-Caribbean | 4.8 | 34.2 | 32.8 | 23.7 | 4.3 | 0.2 |
| CYP2C19, American | 1.5 | 21.4 | 62.8 | 13.6 | 0.7 | 0.0 |
| CYP2C19, Central/South Asian | 8.2 | 40.8 | 29.6 | 18.6 | 2.9 | 0.0 |
| CYP2C19, East Asian | 13.0 | 46.0 | 38.1 | 2.5 | 0.0 | 0.3 |
| CYP2C19, European | 2.4 | 26.2 | 39.6 | 27.1 | 4.6 | 0.0 |
| CYP2C19, Latino | 1.2 | 19.4 | 52.5 | 24.1 | 2.8 | 0.0 |
| CYP2C19, Near Eastern | 1.9 | 23.5 | 45.2 | 25.7 | 3.7 | 0.0 |
| CYP2C19, Oceanian | 57.1 | 36.9 | 3.5 | 2.1 | 0.3 | 0.0 |
| CYP2C19, Sub-Saharan African | 4.7 | 34.2 | 37.0 | 21.1 | 3.0 | 0.0 |
| NAT2, Central/South Asian | 59.8 | 34.4 | — | 5.4 | — | 0.1 |
| NAT2, East Asian | 22.4 | 50.5 | — | 26.7 | — | 0.0 |
| NAT2, European | 59.5 | 35.1 | — | 5.4 | — | 0.0 |
| NAT2, Latino | 46.5 | 42.8 | — | 10.0 | — | 0.7 |
| NAT2, Sub-Saharan African | 44.5 | 41.2 | — | 9.0 | — | 5.2 |
CPIC frequency tables (files.cpicpgx.org), sheet "Phenotype frequency". CYP2D6 values are sums of activity-score rows grouped by the CPIC ranges; rows may not add to exactly 100% because of rounding and, for NAT2, diplotypes without an assigned function. StatPearls (Pharmacogenomics Overview) gives slow-acetylator prevalence of 10–20% in Asian populations and more than 50% in Caucasian and African populations.
The consequences depend on the drug. In healthy volunteers given codeine, CYP2D6 poor metabolizers had a 96% lower mean morphine AUC than normal and intermediate metabolizers, and ultrarapid metabolizers a 45% higher median morphine AUC than normal metabolizers. For clopidogrel, whose active metabolite is formed less in CYP2C19 intermediate and poor metabolizers, CPIC advises avoiding the standard 75 mg dose in intermediate metabolizers and avoiding clopidogrel in poor metabolizers if possible, using prasugrel or ticagrelor when there is no contraindication (acute coronary syndrome or PCI).
Crews KR, et al. Clin Pharmacol Ther 2021;110:888–896 (CYP2D6 activity score, Table 1; codeine data); Lee CR, et al. Clin Pharmacol Ther 2022;112:959–967 (CYP2C19 and clopidogrel, Table 2); Patel T, et al. StatPearls, Cytochrome P450 (2026).
Some botanicals change how fast the liver clears drugs, and human studies show which ones
Induction raises the expression of an enzyme or transporter; St John's wort does this in people, and in primary human hepatocytes its constituent hyperforin acts through the pregnane X receptor. Inhibition lowers the activity of enzyme already present, as goldenseal does for CYP2D6 and CYP3A4/5. Both are measured in people with probe drugs. The midazolam data for St John's wort and goldenseal, plotted against FDA potency categories, are on ADME, PK and PBPK; this section adds the mechanism and other probes.
Show data: CYP2D6 phenotypic ratios before and after each extract
| Extract | Before, mean (95% CI) | After, mean (95% CI) | Post/pre, geometric mean (90% CI) |
|---|---|---|---|
| Goldenseal | 0.708 (0.632–0.785) | 0.374 (0.285–0.463) | 0.53 (0.44–0.64), significant |
| Milk thistle | 0.694 (0.621–0.767) | 0.672 (0.602–0.743) | 0.97 (0.93–1.10) |
| Black cohosh | 0.684 (0.610–0.759) | 0.679 (0.593–0.765) | 0.99 (0.94–1.04) |
| Kava | 0.654 (0.568–0.739) | 0.669 (0.573–0.765) | 1.01 (0.96–1.06) |
| St John's wort | 0.606 (0.522–0.691) | 0.620 (0.537–0.703) | 1.02 (0.97–1.07) |
| Echinacea | 0.583 (0.514–0.653) | 0.601 (0.530–0.673) | 1.03 (0.98–1.07) |
Gurley BJ, Swain A, Hubbard MA, et al. Clinical assessment of CYP2D6-mediated herb–drug interactions in humans. Mol Nutr Food Res 2008;52:755–763 (PMC2562884), Table 1.
| Study | Design | Finding | Evidence type |
|---|---|---|---|
| Moore et al. 2000 | Receptor binding; primary human hepatocytes | Hyperforin from St John's wort binds the pregnane X receptor (PXR) with Ki = 27 nM; extracts or hyperforin markedly induced CYP3A4 expression in hepatocytes | In vitro |
| Dürr et al. 2000 | 8 healthy men, St John's wort extract for 14 days | Duodenal P-glycoprotein 1.4-fold and CYP3A4 1.5-fold; hepatic CYP3A4 activity (14C-erythromycin breath test) 1.4-fold; digoxin exposure after a single 0.5 mg dose 18% lower | Human |
| Markowitz et al. 2003 | 12 healthy volunteers (6 women), 300 mg three times daily for 14 days; alprazolam and dextromethorphan probes | Alprazolam AUC fell 2-fold and clearance rose 2-fold; half-life 12.4 to 6.0 h. Dextromethorphan urinary ratio (CYP2D6) did not change significantly | Human |
| Gurley et al. 2005 | 12 healthy volunteers (6 women), each extract for 28 days; probe cocktail | Goldenseal inhibited CYP2D6 and CYP3A4/5 by about 40%; kava lowered CYP2E1 by about 40%; black cohosh lowered CYP2D6 by about 7%, judged not clinically relevant; valerian had no effect | Human |
| Gurley et al. 2008 | 3 studies of healthy volunteers, 2 extracts each, 14 days per extract | Goldenseal halved the debrisoquine recovery ratio; the five other extracts had no significant effect (figure above) | Human |
Moore LB, et al. Proc Natl Acad Sci USA 2000;97:7500–7502; Dürr D, et al. Clin Pharmacol Ther 2000;68:598–604; Markowitz JS, et al. JAMA 2003;290:1500–1504; Gurley BJ, et al. Clin Pharmacol Ther 2005;77:415–426 (PMC1894911); Gurley 2008. Supplement pages: St John's wort, goldenseal, kava. Interaction overview: Supplement–drug interactions.
Liver tests measure injury, bile flow and synthetic reserve, and each has sources outside the liver
The American College of Gastroenterology prefers the term liver chemistries, because most of the panel reflects injury or cholestasis rather than function. ALT and AST are released when hepatocytes are injured; ALP and GGT point to the bile ducts; bilirubin, albumin and the prothrombin time with its INR say more about how much working liver is left.
| Test | What it reflects | Sources other than the liver | Reference interval (StatPearls) |
|---|---|---|---|
| ALT, alanine aminotransferase | Hepatocyte injury; mostly cytosolic; transfers an amino group from L-alanine to α-ketoglutarate with pyridoxal 5′-phosphate; half-life about 47 h | Kidney, heart, muscle | 4–36 IU/L |
| AST, aspartate aminotransferase | Hepatocyte injury; cytosolic and mitochondrial forms | Skeletal muscle, myocardium, kidney, brain, leukocytes, erythrocytes | 5–30 IU/L |
| ALP, alkaline phosphatase | Concentrated in the canalicular membrane and bile-duct epithelium; rises with impaired bile flow | Bone (over 80% of serum ALP comes from liver and bone), placenta, intestine, kidney | 30–120 IU/L |
| GGT, γ-glutamyltransferase | Confirms a hepatobiliary source for a raised ALP; induced by alcohol and some medicines | Kidney, pancreas, stomach, intestine, placenta, lung (UniProt) | 6–50 IU/L |
| Bilirubin, total and direct | Production, uptake, conjugation and excretion together; the direct fraction approximates conjugated bilirubin and is partly method-defined | Heme from red cells; raised unconjugated bilirubin also in hemolysis and Gilbert syndrome | Total 2–17 µmol/L; direct 0–6 µmol/L |
| Albumin | Synthetic capacity; changes slowly because of its long half-life | Lowered also by inflammation, poor nutrition, renal or gut protein loss | 35–50 g/L |
| Prothrombin time and INR | Liver-made clotting factors; responds faster than albumin because the factors have shorter half-lives | Prolonged also by vitamin K deficiency, anticoagulants, malabsorption | PT 10.9–12.5 s; INR 1.1 or below |
Jogu P, Zubair M, Minter DA. Liver Function Tests. StatPearls, updated Jun 8, 2026 (intervals, tissue sources, interpretation); Moriles KE, et al. Alanine Aminotransferase (ALT) Test. StatPearls; Lowe D, et al. Serum Alkaline Phosphatase. StatPearls, updated Mar 23, 2026; Zubair M, et al. Prothrombin Time. StatPearls, updated Sep 8, 2026 (INR); UniProt P19440; Kwo PY, et al. Am J Gastroenterol 2017;112:18–35.
Reference intervals differ between laboratories, methods and populations; a result is read against the interval printed by the laboratory that measured it. StatPearls notes that most intervals cover the central 95% of a reference population, so some healthy people fall outside them. The ACG guideline puts a "true healthy normal" ALT at 29–33 IU/L for men and 19–25 IU/L for women. LiverTox notes typical laboratory ALT upper limits of 40 or 42 U/L, and 55 or 66 U/L in some laboratories.
StatPearls grades aminotransferase rises against the upper limit of normal (ULN): borderline below 2 × ULN, mild 2 to 5 ×, moderate 5 to 15 ×, severe above 15 ×, and massive above 10,000 IU/L. Mildly raised ALT and AST are found in about 10% to 20% of the general population, and up to 30% of asymptomatic elevations resolve within 3 weeks.
Jogu P, et al. StatPearls 2026; Roussel Uclaf Causality Assessment Method (RUCAM) in Drug Induced Liver Injury. LiverTox, updated May 4, 2019.
The R ratio sorts drug- and supplement-induced injury into hepatocellular, cholestatic and mixed
Drug-induced liver injury (DILI) can mimic almost any liver disease, and no single test proves that a drug, supplement or herb caused it. The first step is the pattern of enzyme rise, captured by the R ratio: ALT divided by ALP, each first expressed as a multiple of its upper limit of normal.
Doubling ALP at a fixed ALT halves R, so the same aminotransferase rise can move from the hepatocellular to the mixed category.
Explanation, details and sources
The updated RUCAM also classifies a case as hepatocellular when ALT > 5 × ULN with ALP ≤ ULN, as cholestatic when ALP > 2 × ULN with ALT ≤ ULN, and as mixed only when ALT > 5 × ULN, ALP > ULN and 2 < R < 5. When ALT is normal, a raised ALP should be matched by a raised GGT to rule out bone or another non-hepatobiliary origin. Sources word the boundaries slightly differently: the LiverTox clinical-course chapter uses R of 5 or more and 2 or less, its RUCAM chapter and the DILIN analysis by Navarro use R > 5 and R < 2.
LiverTox lists five practical problems: timing (early samples look hepatocellular, late ones cholestatic), ALP from bone, cancer or pregnancy, AST used when ALT is missing, which ULN to use, and liver disease that predates the drug. Its recommendation is to use the first qualifying values and the local laboratory's ULN; if none is given, 40 U/L for ALT and 115 U/L for ALP. In the RUCAM, mixed cases are scored as cholestatic.
Danan G, Teschke R. RUCAM in drug and herb induced liver injury: the update. Int J Mol Sci 2016;17:14, section 5.2; LiverTox: Clinical Course and Diagnosis of Drug Induced Liver Disease; Roussel Uclaf Causality Assessment Method (RUCAM) in Drug Induced Liver Injury (both updated May 4, 2019); Navarro 2014, Table 2 footnote.
Hy's law: hepatocellular injury that also raises bilirubin signals a drug able to cause severe injury
The FDA's 2009 guidance on premarketing evaluation of DILI builds on Zimmerman's observation that drug-induced hepatocellular injury with jaundice carried a 10% to 50% mortality from acute liver failure before transplantation was available. Because the liver has a large reserve for excreting bilirubin, injury that raises bilirubin above 2 × ULN is extensive.
- Hepatocellular injuryThe drug causes a higher incidence of 3-fold or greater elevations above the ULN of ALT or AST than the control drug or placebo.
- Bilirubin riseAmong those subjects, one or more also show serum total bilirubin above 2 × ULN, without initial findings of cholestasis (raised serum ALP).
- No other reasonNo other cause explains the combination, such as viral hepatitis A, B or C, preexisting or acute liver disease, or another drug capable of causing the injury.
The guidance states that one Hy's law case in a clinical trial database is worrisome and two are considered highly predictive of a drug's potential to cause severe DILI in a larger population. Severe DILI, fatal or requiring transplant, can be estimated to occur at a rate of at least one-tenth the rate of Hy's law cases. Severe injury is usually rare, about 1 in 10,000 or less, so an approval database often contains none.
FDA 2009 guidance, section III (pages 4–5). The guidance addresses drugs in clinical development; LiverTox notes that U.S. supplement manufacturers need not have FDA approval before marketing (Herbal and Dietary Supplements chapter, updated Jul 1, 2025).
RUCAM scores how likely it is that one agent caused the injury
The Roussel Uclaf Causality Assessment Method, introduced in 1993 and updated in 2016, assigns points in seven categories and sums them. Each suspected agent gets its own score, and the course and risk-factor items are scored differently for hepatocellular and for cholestatic or mixed injury.
| Category | Points | What earns the most points |
|---|---|---|
| 1. Time to onset | +1 or +2 | Onset 5 to 90 days after a first exposure while still taking the agent |
| 2. Course after stopping | −2 to +3 (hepatocellular); 0 to +2 (cholestatic or mixed) | ALT falls by 50% within 8 days; for cholestatic injury, ALP or bilirubin falls by more than 50% within 180 days |
| 3. Risk factors | 0 or +1 each, two items | Alcohol use (or pregnancy for cholestatic injury); age 55 or older |
| 4. Concomitant drugs | 0 to −3 | No other drug with a compatible time to onset |
| 5. Non-drug causes | −3 to +2 | Hepatitis A, B and C, biliary obstruction, alcoholic liver disease, ischemic hepatitis and complications of underlying disease reasonably ruled out |
| 6. Previous information | 0, +1 or +2 | Liver injury stated in the product label |
| 7. Rechallenge | −2 to +3 | ALT doubles (or ALP or bilirubin for cholestatic injury) with the drug alone |
| Total score | ≤ 0 | 1–2 | 3–5 | 6–8 | ≥ 9 |
|---|---|---|---|---|---|
| Causality | Excluded | Unlikely | Possible | Probable | Highly probable |
The full range is −9 to +14, but LiverTox notes that without rechallenge and without the special risk factors the range for cholestatic or mixed injury is only −5 to +8, so many cases cannot score above "probable". The U.S. Drug-Induced Liver Injury Network instead uses expert opinion: definite (> 95% likelihood), highly likely (75–95%), probable (50–74%), possible (25–49%) or unlikely (< 25%).
Danan G, Teschke R. Int J Mol Sci 2016;17:14 (score bands, section 5.3.8); LiverTox, RUCAM chapter, updated May 4, 2019 (categories, points, ranges); Chalasani N, et al. Gastroenterology 2015;148:1340–1352 (DILIN causality scale).
LiverTox grades how firmly the literature links each agent to liver injury
LiverTox, the National Institute of Diabetes and Digestive and Kidney Diseases (NIDDK) reference on drug-induced liver injury, gives each drug, herb or supplement a likelihood score developed by the DILIN. The score is based largely on the published literature: how many cases have been described and whether the injury has a characteristic signature.
| Category | LiverTox definition (abridged) |
|---|---|
| A | Well known, well described and well reported to cause direct or idiosyncratic liver injury, with a characteristic signature; more than 50 cases including case series |
| B | Reported and known or highly likely to cause idiosyncratic liver injury, with a characteristic signature; between 12 and 50 cases including small case series |
| C | Probably linked but reported uncommonly, no characteristic signature; fewer than 12 cases without significant case series |
| D | Single case reports, fewer than 3 cases, no characteristic signature; a possible hepatotoxin and only a rare cause |
| E | No evidence of liver injury despite extensive use; single reports largely unconvincing |
| E* | Suspected but no convincing cases in the medical literature |
| X | Recently introduced or rarely used; too little information to categorize ("unknown") |
Show data: the category A botanicals and the category B examples, as their LiverTox chapters describe them
| Botanical (chapter, last update) | Score | What the chapter describes |
|---|---|---|
| Black cohosh (Apr 15, 2025) · supplement page | A | "Products sold as black cohosh" are established causes; more than fifty instances; latency usually 2 to 12 weeks; typically hepatocellular. The specific responsible component is unclear; Chinese Actaea species have been found in implicated products labeled black cohosh |
| Germander (Mar 12, 2018) | A | First reported in France in 1992 after a germander weight-loss product; onset 2 to 18 weeks; hepatocellular; centrilobular necrosis on biopsy; rapid recurrence on reexposure |
| Green tea (Nov 20, 2020) · supplement page | A | Cases involve mainly green tea extract and, more rarely, large amounts of green tea; drinking green tea has not been associated with injury or enzyme rises. More than 100 cases; onset 1 to 6 months; markedly hepatocellular. In a large prospective trial, ALT rose in 6.7% of women on extract versus 0.7% of controls |
| Kava (Apr 10, 2018) · supplement page | A | Between 50 and 100 cases published or discussed; onset 2 to 24 weeks; hepatocellular; estimated frequency below 1 in 1,000,000 daily doses, with the caveat that spontaneous reporting captures under 1% of severe events |
| Polygonum multiflorum (Aug 18, 2020) · he shou wu page | A | Reported in China as the most common cause of herbal liver injury; hepatocellular or mixed; up to 10% of clinically apparent cases fatal or transplanted; HLA-B*35:01 in 70% to 88% of cases in recent series |
| Tinospora (Jun 27, 2025) · guduchi page | A | Tinospora cordifolia: more than 50 cases reported since 2017, many during the COVID-19 pandemic, mostly from India and Thailand |
| Turmeric (Jun 16, 2025) · supplement page | A | Appears to have become the most common cause of clinically apparent herbal liver injury in the United States; most cases with high-bioavailability curcumin; latency typically 1 to 4 months; HLA-B*35:01 in over 70% of cases versus 10% to 15% of controls; incidence not known, probably 1 in 10,000 to 1 in 100,000 exposed |
| Aloe vera (May 24, 2022) · supplement page | B | Oral preparations; at least a dozen cases since 2005; onset 3 to 24 weeks; hepatocellular; fatal cases not reported |
| Ashwagandha (Dec 3, 2024) · supplement page | B | No enzyme rises in clinical trials, but cases with labeled products; onset 2 to 12 weeks; usually cholestatic or mixed with prolonged jaundice; rare fatal cases or emergency transplantation, particularly with preexisting liver disease or cirrhosis |
| Chaparral (May 25, 2022) | B | More than two dozen cases since 1990; usually 3 to 12 weeks; hepatocellular; some needed emergency transplantation |
| Garcinia cambogia (Feb 13, 2019) | B | At least a dozen reports, many with multi-ingredient products; hepatocellular; frequency likely below 1 in 10,000 |
| Pennyroyal oil (Mar 28, 2020) | B | Acute, clinically apparent liver injury |
| Skullcap (Mar 28, 2020) | B | American skullcap (Scutellaria lateriflora); often with other herbs, and germander adulteration found in some products. The chapter also describes case reports with Chinese skullcap (S. baicalensis; see the Baikal skullcap page), a different species |
LiverTox: Clinical and Research Information on Drug-Induced Liver Injury. NIDDK, 2012–; individual chapters as dated; NLM full-text release of Oct 28, 2026. The LiverTox disclaimer in that release reads: “As of September 2026, initial drafts of new and updated LiverTox chapters will be generated using Artificial Intelligence. Each draft will then undergo careful review, verification, and editing by the LiverTox editorial team.” Examples in categories C–E come from the chapters for butterbur, Centella asiatica, comfrey, horsetail, noni and valerian (C); echinacea, cinnamon, saw palmetto, senna, moringa and yerba mate (D); and milk thistle, St John's wort, ginkgo, ginger, berberine and chamomile (E).
Herbal and dietary supplements make up a rising share of U.S. drug-induced liver injury cases
The DILIN enrolls consecutive patients with suspected DILI at U.S. referral centers and adjudicates causality by expert panel. Among 839 cases enrolled from 2004 to 2013, 130 (15.5%) were attributed to herbal and dietary supplements (HDS): 45 to bodybuilding products and 85 to other supplements.
Show data: DILIN cases by period and by pattern
| Measure | Bodybuilding HDS | Other HDS | Medications | All HDS |
|---|---|---|---|---|
| Share of cases, 2004–05 | 2% | 5% | — | 7% |
| Share of cases, 2010–12 | 8% | 12% | — | 20% |
| Hepatocellular at onset | 18 (42%) | 56 (71%) | 351 (53%) | — |
| Mixed at onset | 13 (30%) | 13 (17%) | 150 (23%) | — |
| Cholestatic at onset | 12 (28%) | 10 (13%) | 164 (25%) | — |
| Liver transplantation | 0 (0%) | 11 (13%) | 24 (3%) | — |
| Death | 0 (0%) | 3 (4%) | 50 (7%) | — |
Navarro VJ, Barnhart H, Bonkovsky HL, et al. Hepatology 2014;60:1399–1408 (PMC4293199), abstract, Results and Table 2.
Bodybuilding products caused prolonged jaundice (median 91 days) in young men without deaths or transplants; the other supplements caused mostly hepatocellular injury, predominantly in middle-aged women, and required liver transplantation more often than injury from medications (13% versus 3%; deaths 4% versus 7%, Table 2). A later DILIN analysis of 899 cases attributed 145 to supplements. In the national transplant waiting list, supplements rose from 2.9% to 24.1% of drug-induced acute liver failure not caused by acetaminophen, between 1995–2003 and 2013–2020.
The authors caution that the DILIN is not population-based, so a rising share does not prove that the injury itself is becoming more common in the United States. LiverTox adds that supplement products can be contaminated, adulterated or mislabeled, citing germander found in products labeled skullcap and Asian Actaea species in products labeled black cohosh, so chemical analysis of the implicated product can matter for causality.
Navarro 2014; Chalasani N, et al. Gastroenterology 2015;148:1340–1352; Ghabril M, et al. Liver Transpl 2022;28:169–179 (UNOS 1995–2020); LiverTox, Herbal and Dietary Supplements, updated Jul 1, 2025. Botanical identity and contaminant testing: Contaminants.
Where EUTECNIQ would work
EUTECNIQ would confirm botanical identity and screen for adulterants before any liver-safety question is asked, test extracts against P450 and transporter probes in vitro, and report exposure as parent compounds and conjugates. Liver tests in any human study would be read with the R ratio and Hy's law thresholds above. None of this exists yet.
Related pages: ADME, PK and PBPK · Risk assessment · Contaminants · Supplement–drug interactions · Supplements A–Z
Health information notice
These statements have not been evaluated by the Food and Drug Administration. Nothing on this site is intended to diagnose, treat, cure or prevent any disease. The information is for general education only. It is not medical advice and does not replace advice, diagnosis or treatment from a qualified health professional, or any medication a clinician has prescribed.
Do not start, stop or change any medicine, supplement or herbal product because of something you read here. Talk to your doctor or pharmacist first, especially if you are pregnant or breastfeeding, have a medical condition, take any medicines, are preparing for surgery, or are caring for a child. Research findings, traditional uses and safety data are reported as their sources state them; they are not recommendations or claims about any product. If you think you may have a medical emergency, call your doctor or 911 at once.
EUTECNIQ Sciences sells no supplements or health products today and receives nothing from any product or ingredient mentioned on this site; any commercial interest it later has in an ingredient will be stated on that ingredient’s page.