

ADME, PK and PBPK
What the body does to a botanical compound between the dose and the tissue, and the equations and physiological models that describe it. Each value is tied to the primary source it came from.
ICRP Publication 89 (2002), Table 2.40; Helander and Fändriks, Scand J Gastroenterol 2014; Paine et al., Drug Metab Dispos 2006; Mueller et al., Eur J Clin Pharmacol 2006.
Status. EUTECNIQ is in formation and has no laboratory, studies or models running. The calculator and computed curves on this page are educational models, not predictions for any product or ingredient.
Related: Bioavailability design · Evidence and pharmacokinetics · Translational research · Dosage forms
ADME and the routes in
Absorption moves a compound from the dosing site into the blood. Distribution carries it to tissues, metabolism changes its structure, and excretion removes parent compound and metabolites. The route of entry decides whether the liver meets the dose before the rest of the body does.
An oral dose crosses the gut wall and travels in the hepatic portal vein to the liver, which can remove part of it on this first pass. Sublingual, buccal, inhaled and transdermal doses, and compounds carried in intestinal lymph, reach the systemic veins without passing the liver first.


Text version of the drawing: the oral route, step by step
- MouthThe dose is swallowed; a sublingual or buccal dose would instead drain to the jugular veins.
- StomachThe dosage form disintegrates and dissolves at gastric pH 1.0–2.5.
- Small intestineDissolved compound crosses the gut wall, where CYP3A, UGT and the efflux pumps P-gp and BCRP act.
- Portal veinBlood from the stomach, intestines, spleen and pancreas carries the absorbed compound to the liver.
- LiverHepatocytes metabolize part of it and can excrete parent compound or conjugates into bile.
- Systemic circulationWhat escapes reaches the inferior vena cava, the heart and every organ in parallel.
| Process | What happens | Main sites | Measured as |
|---|---|---|---|
| Absorption | Movement from the dosing site into the blood | Small intestine for oral doses; oral mucosa, lung or skin for other routes | Fraction absorbed Fa; absorption rate constant ka; tmax |
| Distribution | Reversible exchange between blood and tissues | All perfused tissues; brain behind the blood–brain barrier | Volume of distribution V; tissue-to-plasma ratio Kp; fraction unbound fu |
| Metabolism | Enzymatic change in structure: phase I (mostly oxidation by CYPs), phase II (conjugation) | Liver; gut wall | Intrinsic clearance CLint; metabolite profile |
| Excretion | Removal of parent compound and metabolites | Kidneys (urine); liver (bile, then feces); lungs for volatile compounds | Renal and biliary clearance; recovery in urine and feces |
Jones HM, Rowland-Yeo K. CPT Pharmacometrics Syst Pharmacol 2013;2:e63; Grogan S, Preuss CV. Pharmacokinetics. StatPearls, updated July 30, 2023; Zanger UM, Schwab M. Pharmacol Ther 2013;138:103–141.
| Route | Enters the blood through | Liver first? | U.S. regulatory note |
|---|---|---|---|
| Oral, swallowed | Gut wall → hepatic portal vein → liver | Yes | A dietary supplement must be “intended for ingestion” (21 U.S.C. 321(ff)) |
| Sublingual, buccal | Oral mucosa → jugular veins → superior vena cava | No | FDA: sublingual products “are not dietary supplements and are not foods” (warning letter, Feb 5, 2019); buccal status depends on the intended absorption site |
| Inhaled | Alveoli → pulmonary veins → left heart → arteries | No | FDA has issued warning letters to inhaled caffeine products |
| Transdermal | Skin → dermal capillaries → systemic veins | No | Transdermal and topical products “are not dietary supplements” (FDA warning-letter language) |
| Intestinal lymph (part of an oral dose) | Lacteal → mesenteric lymph → thoracic duct → junction of the left subclavian and internal jugular veins | No | Not a separate route of administration; applies to highly lipophilic compounds (section 2) |
ICRP Publication 89 (2002), §7.7 (portal circulation); Ilahi M, et al. Anatomy, Thorax, Thoracic Duct. StatPearls, updated July 24, 2023; 21 U.S.C. 321(ff); FDA warning letter 566205 (DK Vitamins), Feb 5, 2019; Gaffney A. Regulatory Focus (RAPS), June 6, 2013. Dosage-form status in detail: Dosage forms.
The gastrointestinal tract
Most oral absorption happens in the small intestine, which is long, close to neutral and folded into a large surface. Gastric emptying and small-intestinal transit set how long a dissolved compound has to cross the wall; the colon holds contents far longer but has a much smaller surface.
| Segment | Length, cm (adult male) | Luminal pH, mean (SD) | Transit time (adult male) |
|---|---|---|---|
| Mouth | — | — | Solids 15 s; liquids 2 s |
| Esophagus | 28 | — | Solids 8 s (fast 90% of the bolus) |
| Stomach | — | 1.0–2.5 (range, all subjects) | Solids 75 min; caloric liquids 45 min; non-caloric liquids 30 min |
| Small intestine | 280 | 6.6 (0.5) proximal, first hour; 7.5 (0.4) terminal ileum | 4 h |
| Duodenum, jejunum, ileum | ≈22, ≈104, ≈154 (8%, 37%, 55%) | — | — |
| Large intestine | 110 (right colon 34, left colon 38, rectosigmoid 38) | 6.4 (0.4) cecum; 7.0 (0.7) left colon | Right colon 12 h; left colon 12 h; rectosigmoid 12 h |
Lengths and transit: ICRP Publication 89 (2002), Tables 2.11 and 2.37 and §6.3.10 (segment percentages; segment lengths computed from them). pH: Evans DF, et al. Gut 1988;29:1035–1041 (66 subjects, radiotelemetry capsule). Female transit times differ (stomach solids 105 min; each colon segment 16 h).
| Measure | Value |
|---|---|
| Mean total mucosal surface, whole digestive tract | ≈32 m², of which ≈2 m² in the large intestine |
| Surface amplification, small intestine | Plicae circulares ≈1.6×; villi and microvilli together 60–120× |
| Mean inner diameter | Small intestine 2.5 cm; large intestine 4.8 cm |
| Oro-anal length, intubation and radiology | ≈5 m, about two thirds of it small intestine |
Helander HF, Fändriks L. Scand J Gastroenterol 2014;49:681–689. The textbook figure of 260–300 m² (“a tennis court”) is not supported by their morphometry.
Highly lipophilic compounds can leave the enterocyte inside chylomicrons. These lipoproteins enter the lacteal, not the blood capillary, so the compound reaches the blood through the thoracic duct and escapes the liver's first pass.
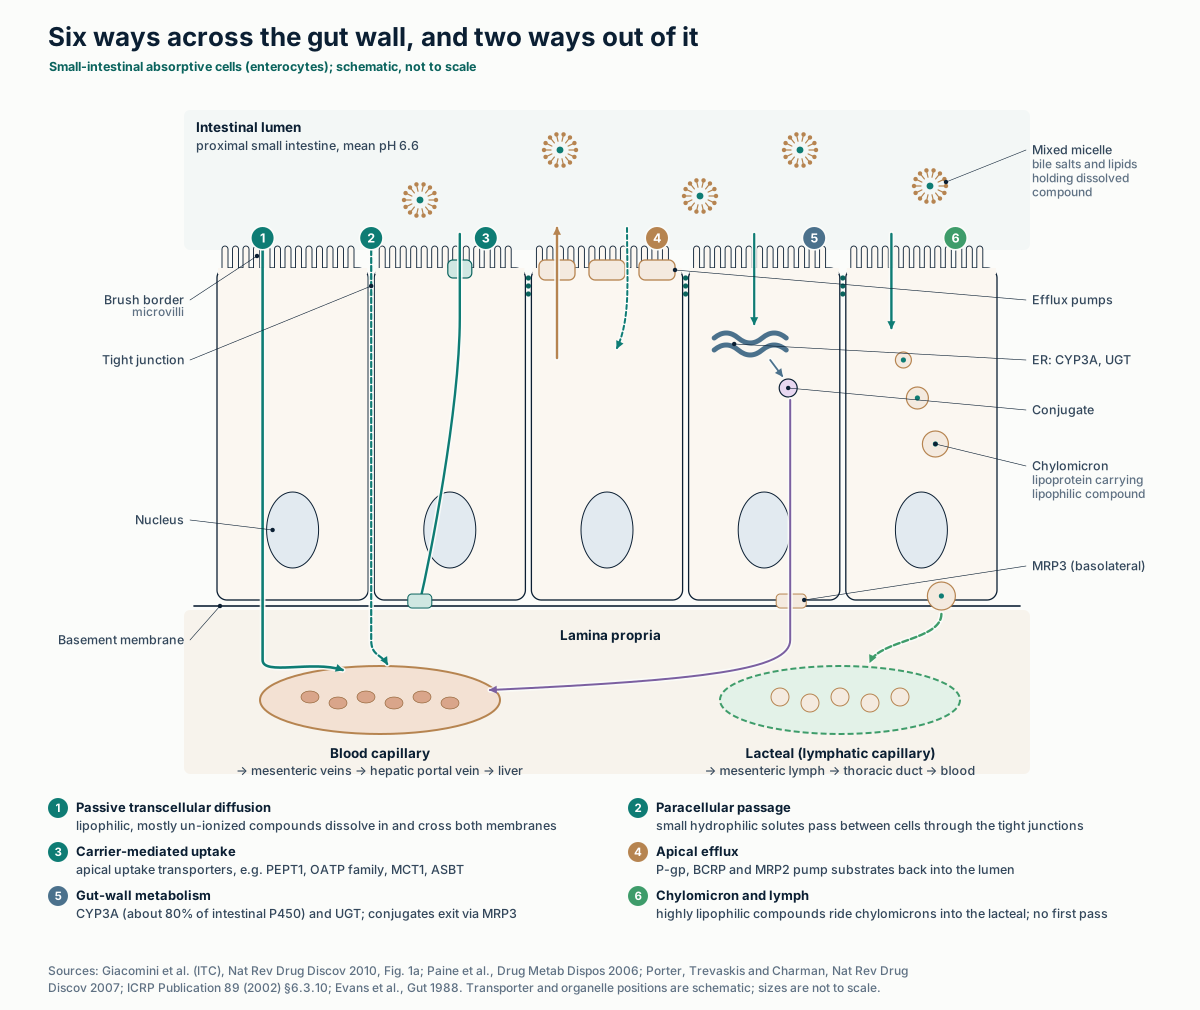
Text version of the drawing: six ways across the gut wall
1, passive diffusion through the cell; 2, paracellular passage through tight junctions; 3, uptake by apical carriers such as PEPT1, OATP and MCT1; 4, efflux back to the lumen by P-gp, BCRP and MRP2; 5, metabolism by CYP3A and UGT inside the cell, with conjugates leaving through basolateral MRP3; 6, incorporation into chylomicrons and exit to the lacteal.
| Item | Value | Caveat |
|---|---|---|
| Lipophilicity of lymph-transported drugs | Typically log P > 5 | A guide, not a threshold |
| Solubility in long-chain triglyceride | Typically > 50 mg/g | “Not an absolute requirement”: two CETP inhibitors in dogs were mainly lymph-transported, one below 50 mg/g |
| Thoracic duct | Begins at the cisterna chyli (L2); 38–45 cm long; empties at the junction of the left subclavian and internal jugular veins | Anatomical variants occur |
Porter CJH, Trevaskis NL, Charman WN. Nat Rev Drug Discov 2007;6:231–248 (criteria from Charman and Stella, Int J Pharm 1986); Trevaskis NL, et al. Pharm Res 2010;27:878–893; Ilahi M, et al. StatPearls, Thoracic Duct, 2023.
Properties that predict absorption
Five molecular properties do most of the work: water solubility; lipophilicity, as log P for the neutral form or log D at a stated pH; the pKa of ionizable groups; molecular size; and polar surface area. Rules built on them flag likely permeability problems. They say nothing about metabolism.
Curcumin meets the Lipinski and Veber limits below, yet after 10 g and 12 g oral doses free curcumin was detected in only one of twelve subjects, while its glucuronide and sulfate conjugates were found in all. Low water solubility and extensive conjugation, not membrane permeation, limit exposure to the parent compound.
| Rule | Criteria | Built from |
|---|---|---|
| Lipinski “rule of 5” | Poor absorption or permeation more likely with > 5 H-bond donors, > 10 H-bond acceptors, molecular weight > 500, or CLogP > 5 (MLogP > 4.15) | Discovery compounds, Pfizer |
| Veber | ≤ 10 rotatable bonds and polar surface area ≤ 140 Ų (or ≤ 12 H-bond donors plus acceptors) | Oral bioavailability in rats, > 1,100 candidates, GSK |
| BCS, ICH M9 | Highly soluble: highest single therapeutic dose dissolves in ≤ 250 mL over pH 1.2–6.8 at 37 ± 1 °C. Highly permeable: absolute bioavailability ≥ 85%, or ≥ 85% of the dose recovered in urine as parent compound or phase 1 and phase 2 metabolites. Four classes from these two tests | Biowaiver criteria for immediate-release oral drugs |
| CNS MPO | Six properties (ClogP, ClogD7.4, MW, TPSA, H-bond donors, most basic pKa) combined into a 0–6 score | 119 marketed CNS drugs and 108 Pfizer CNS candidates |
Lipinski CA, et al. Adv Drug Deliv Rev 2001;46:3–26; Veber DF, et al. J Med Chem 2002;45:2615–2623; ICH M9, Biopharmaceutics Classification System-Based Biowaivers, adopted November 20, 2019, §2.1–2.2; Wager TT, et al. ACS Chem Neurosci 2010;1:435–449; Vareed SK, et al. Cancer Epidemiol Biomarkers Prev 2008;17:1411–1417.
Show data: properties and rule checks for the ten compounds
| Compound | PubChem CID | MW, g/mol | XLogP3 | TPSA, Ų | HBD | HBA | Rotatable bonds | Lipinski violations | Veber met |
|---|---|---|---|---|---|---|---|---|---|
| Caffeine | 2519 | 194.19 | −0.1 | 58.4 | 0 | 3 | 0 | 0 | yes |
| Resveratrol | 445154 | 228.24 | 3.1 | 60.7 | 3 | 3 | 2 | 0 | yes |
| Quercetin | 5280343 | 302.23 | 1.5 | 127 | 5 | 7 | 1 | 0 | yes |
| Curcumin | 969516 | 368.4 | 3.2 | 93.1 | 2 | 6 | 8 | 0 | yes |
| Piperine | 638024 | 285.34 | 3.5 | 38.8 | 0 | 3 | 3 | 0 | yes |
| EGCG | 65064 | 458.4 | 1.2 | 197 | 8 | 11 | 4 | 2 (HBD, HBA) | no (TPSA) |
| Berberine (cation, charge +1) | 2353 | 336.4 | 3.6 | 40.8 | 0 | 4 | 2 | 0 | yes |
| Hyperforin | 441298 | 536.8 | 9.6 | 71.4 | 1 | 4 | 11 | 2 (MW, log P) | no (rotatable bonds) |
| Hypericin | 3663 | 504.4 | 5.7 | 156 | 6 | 8 | 0 | 3 (HBD, MW, log P) | no (TPSA) |
| (−)-Hydrastine | 197835 | 383.4 | 2.7 | 66.5 | 0 | 7 | 3 | 0 | yes |
PubChem, National Center for Biotechnology Information, compound records by CID, retrieved October 27, 2026. Rule checks computed on this page from those values.
First pass and the enzymes
Oral bioavailability is a product of three fractions: absorbed (Fa), escaping the gut wall (Fg) and escaping the liver (Fh). In the well-stirred liver model, hepatic extraction is EH = fu·CLint / (QH + fu·CLint), with Fh = 1 − EH.
With the ICRP reference liver blood flow of 99.5 L/h, a compound whose unbound intrinsic clearance equals that flow loses half of what reaches the liver. As fu·CLint grows far beyond QH, hepatic clearance approaches liver blood flow.
| Enzyme or transporter | Reaction or role | Where, and variability | FDA sensitive substrate (example) | FDA strong inhibitor or inducer (examples) |
|---|---|---|---|---|
| CYP3A4 | Phase I oxidation | Among the most highly expressed liver CYPs; ≈80% of intestinal P450 | Midazolam | Inhibitors: ketoconazole, itraconazole, clarithromycin. Inducers: rifampin, St John's wort |
| CYP2D6 | Phase I oxidation | Less abundant in liver; polymorphic (poor to ultrarapid metabolizers) | Desipramine, dextromethorphan | Inhibitors: fluoxetine, paroxetine, quinidine, bupropion. No strong inducer listed |
| CYP2C9 | Phase I oxidation | Highly expressed in liver; ≈15% of intestinal P450; polymorphic | Celecoxib | None listed as strong |
| CYP2C19 | Phase I oxidation | Less abundant in liver; polymorphic | Omeprazole, S-mephenytoin | Inhibitors: fluconazole, fluoxetine, fluvoxamine. Inducer: rifampin |
| CYP1A2 | Phase I oxidation | Highly expressed in liver; not or only faintly detected in intestine | Caffeine, melatonin | Inhibitor: fluvoxamine |
| CYP2E1 | Phase I oxidation | Highly expressed in liver; not or only faintly detected in intestine | Not in the FDA table | — |
| UGT | Phase II glucuronidation (UDP-glucuronic acid donor) | 22 human proteins; liver has the most, with significant extrahepatic expression | — | — |
| SULT | Phase II sulfation (PAPS donor) | Cytosolic family; usually detoxifying, sometimes bioactivating | — | — |
| P-gp (ABCB1) | ATP-dependent efflux | Luminal membrane of intestine and blood–brain barrier; canalicular membrane of hepatocytes; kidney | Digoxin, dabigatran etexilate, fexofenadine | Inhibitors: itraconazole, quinidine, clarithromycin |
| BCRP (ABCG2) | ATP-dependent efflux | Apical membrane of intestine; blood–brain barrier; canalicular membrane | Rosuvastatin, sulfasalazine | Inhibitors include curcumin and cyclosporine |
Zanger UM, Schwab M. Pharmacol Ther 2013;138:103–141 (expression and polymorphism); Paine MF, et al. Drug Metab Dispos 2006;34:880–886 (intestinal P450, 31 donors); Rowland A, et al. Int J Biochem Cell Biol 2013;45:1121–1132; Coughtrie MWH. Chem Biol Interact 2016;259:2–7; Giacomini KM, et al. Nat Rev Drug Discov 2010;9:215–236; U.S. FDA, Examples of Drugs that Interact with CYP Enzymes and Transporter Systems, content current as of May 29, 2026 (Tables 1–3). FDA groups CYP3A4 and CYP3A5 as “CYP3A”.
The blood–brain barrier
Brain capillary endothelial cells are sealed to each other by tight junctions, carry efflux pumps such as P-gp and BCRP on the blood-facing membrane, and are covered by pericytes and astrocyte end-feet. A compound reaches brain tissue mainly by diffusing through these cells or by riding an uptake transporter.
Once there, the unbound concentration at the target sets receptor occupancy by mass action. The CNS MPO score summarizes six properties that favor entry; in its original analysis, 74% of 119 marketed CNS drugs scored 4 or more out of 6, against 60% of 108 Pfizer CNS candidates.
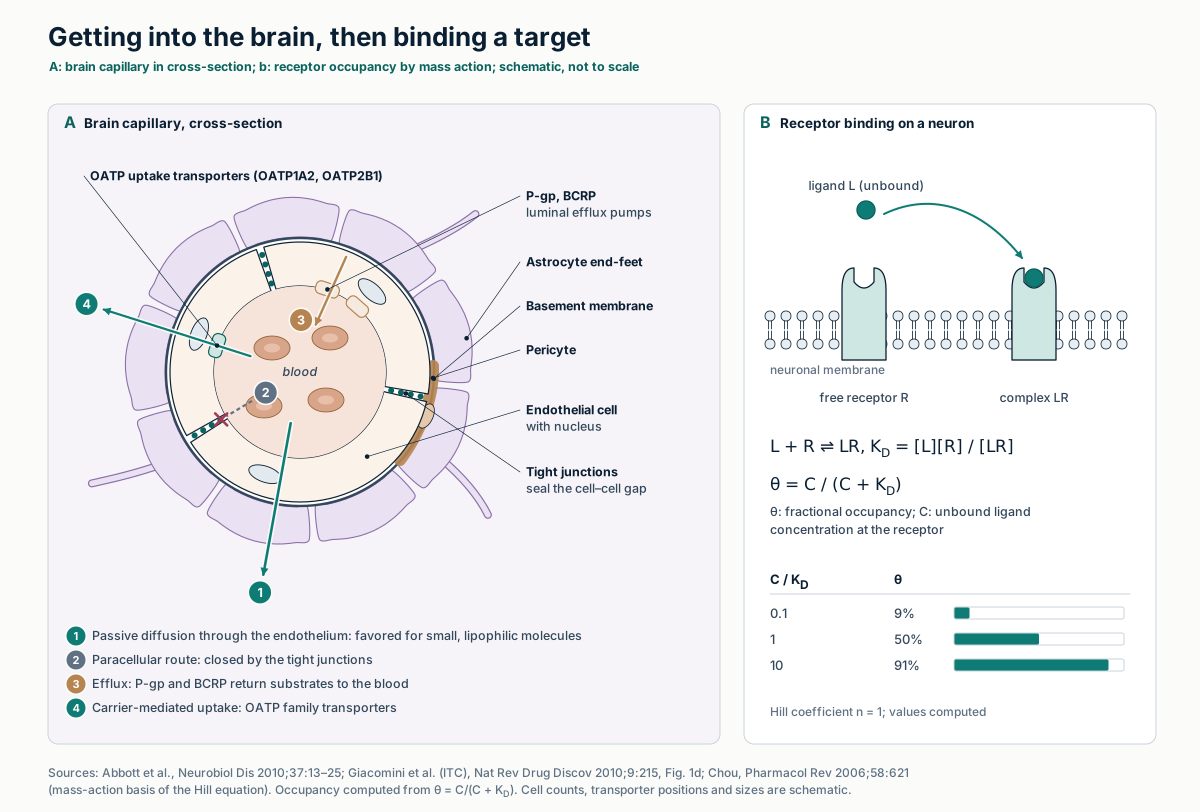
Text version of the drawing
Panel A: a brain capillary in cross-section, with four paths: passive diffusion through the endothelium; the paracellular route, closed by tight junctions; efflux to blood by P-gp and BCRP; and uptake by OATP1A2 and OATP2B1. Panel B: fractional occupancy θ = C/(C + KD) gives 9%, 50% and 91% at C equal to 0.1, 1 and 10 times KD.
| CNS MPO property | What it represents |
|---|---|
| ClogP | Calculated lipophilicity of the neutral molecule |
| ClogD at pH 7.4 | Calculated distribution coefficient, counting ionized forms at blood pH |
| Molecular weight | Size |
| Topological polar surface area | Polarity, from N and O atoms and their hydrogens |
| H-bond donors | Number of donor groups |
| Most basic pKa | Ionization of the most basic center |
Abbott NJ, et al. Neurobiol Dis 2010;37:13–25; Giacomini KM, et al. Nat Rev Drug Discov 2010;9:215–236, Fig. 1d; Wager TT, et al. ACS Chem Neurosci 2010;1:435–449. Higher scores also aligned with favorable permeability, P-gp efflux, metabolic stability and safety attributes in that analysis.
Concentration over time
A one-compartment model treats the body as one well-mixed volume. Clearance (CL) sets how fast the compound is removed; the volume of distribution (V) relates the amount in the body to the plasma concentration. Their ratio is the elimination rate constant k = CL/V, and the half-life is t½ = ln 2 · V/CL.
After an oral dose with first-order absorption and bioavailability F, total exposure is AUC = F·Dose/CL, whatever V and ka are. Repeated doses accumulate until, after four to five half-lives, intake and elimination balance.
| Quantity | Equation |
|---|---|
| Elimination rate constant, 1/h | k = CL / V |
| Half-life, h | t½ = ln 2 / k = 0.693 · V / CL |
| Intravenous bolus | C(t) = (Dose / V) · e−kt |
| Oral dose, first-order absorption (ka ≠ k) | C(t) = F·Dose·ka / [V(ka − k)] · (e−kt − e−kat) |
| Time of the peak | tmax = ln(ka/k) / (ka − k) |
| Exposure | AUC0–∞ = F · Dose / CL |
| Absolute bioavailability | F = (AUCoral · DoseIV) / (AUCIV · Doseoral) |
| Accumulation ratio, dosing interval τ | R = 1 / (1 − e−kτ) |
Grogan S, Preuss CV. Pharmacokinetics. StatPearls, updated July 30, 2023 (definitions of half-life, volume, clearance, bioavailability; steady state in four to five half-lives); Mould DR, Upton RN. CPT Pharmacometrics Syst Pharmacol 2013;2:e38 (first-order absorption; “flip-flop” kinetics when absorption is slower than elimination). Remaining expressions follow algebraically from the oral equation.
Interactive calculator Change the inputs and the result updates. An educational simulation with stated inputs.
Show data
| Time, h | Concentration, mg/L |
|---|---|
| 0 | 0 |
Method, assumptions and limits: concentration–time calculator
- What it calculates
- Plasma concentration after one or more equal oral doses in a one-compartment model with first-order absorption and elimination, summed by superposition.
- Equations
- k = CL/V; t½ = ln 2/k; per dose Ci(t) = F·D·ka/[V(ka − k)]·(e−k(t−ti) − e−ka(t−ti)) for t ≥ ti; when ka = k, Ci(t) = F·D·k·(t − ti)·e−k(t−ti)/V; AUC0–∞ = F·D/CL; R = 1/(1 − e−kτ).
- Units
- Dose in mg, CL in L/h, V in L, so concentration is in mg/L (equal to µg/mL); time in hours.
- Assumptions
- Linear kinetics; one well-mixed compartment; no lag time; constant F; parent compound only.
- What it does not establish
- It does not describe any botanical constituent, and it ignores metabolites, which for compounds such as curcumin carry most of the measured exposure.
Concentration to effect
The sigmoid Emax (Hill) model links concentration to effect: E = E0 + Emax·Cn/(EC50n + Cn). EC50 is the concentration giving half the maximal effect; the Hill coefficient n sets the steepness. With n = 1 it has the same form as mass-action binding.
A steep curve covers the whole response in a narrow concentration range, so a change in exposure, for example from an interaction, moves the effect more.
| Hill coefficient n | C90/C10 (concentration range from 10% to 90% of Emax) |
|---|---|
| 0.5 | 6,561-fold |
| 1 | 81-fold |
| 2 | 9-fold |
| 4 | 3-fold |
Computed: C90/C10 = 811/n, from the Hill equation solved for C at E/Emax = 0.1 and 0.9.
Physiologically based models
A PBPK model represents organs as compartments with measured volumes and blood flows, connected in parallel between arterial and venous blood, with the lungs in series and the gut, spleen and pancreas draining to the liver. For a perfusion-limited tissue, VT·dCT/dt = QT·(CA − CT·B:P/Kp). Drug-specific inputs such as Kp, fu and CLint then give concentration–time curves in each tissue.
Regulators judge PBPK analyses case by case. FDA's 2018 guidance sets the format of a PBPK report; EMA's guideline, in effect since July 1, 2019, also asks that the modeling platform be qualified for its intended use.
| Tissue | Mass, g (adult male) | Blood flow, % of cardiac output (male / female) | Blood flow, L/min (male, computed) |
|---|---|---|---|
| Liver | 1,800 | 25.5 / 27.0 total (6.5 arterial) | 1.66 |
| Kidneys (2) | 310 | 19 / 17 | 1.24 |
| Skeletal muscle | 29,000 | 17 / 12 | 1.11 |
| Brain | 1,450 | 12 / 12 | 0.78 |
| Small intestine (wall) | 650 | 10 / 11 | 0.65 |
| Adipose tissue | 18,200 | 5.0 / 8.5 | 0.33 |
| Skin | 3,300 | 5.0 / 5.0 | 0.33 |
| Heart (tissue; coronary flow) | 330 | 4.0 / 5.0 | 0.26 |
| Large intestine (wall) | 370 | 4.0 / 5.0 | 0.26 |
| Spleen | 150 | 3.0 / 3.0 | 0.20 |
| Lungs (tissue; bronchial flow) | 500 | 2.5 / 2.5 (all cardiac output passes the pulmonary circulation) | 0.16 |
| Stomach and esophagus (wall) | 150 (stomach) | 1.0 / 1.0 | 0.065 |
| Pancreas | 140 | 1.0 / 1.0 | 0.065 |
ICRP Publication 89 (2002): Table 2.8 (masses), Table 2.39 (cardiac output 6.5 L/min male, 5.9 L/min female), Table 2.40 (flows); reference body mass 73 kg male, 60 kg female (Table 2.9). L/min computed as 6.5 × percentage. Large-intestine wall: right colon 150 + left colon 150 + rectosigmoid 70 g.
| Document | Dates and status | What it covers |
|---|---|---|
| FDA, Physiologically Based Pharmacokinetic Analyses — Format and Content (docket FDA-2016-D-3969) | September 2018; final guidance, CDER | A six-section PBPK study report: executive summary, introduction, materials and methods, results, discussion, appendices. Does not address modeling methods; acceptance in place of clinical data is decided case by case |
| EMA, Guideline on the reporting of PBPK modelling and simulation (EMA/CHMP/458101/2016) | Adopted by CHMP December 13, 2018; in effect July 1, 2019 | Report content, and qualification of the PBPK platform for the intended purpose with requirements scaled to regulatory impact; applies to commercial and in-house platforms |
U.S. FDA guidance page, content current as of October 18, 2019; EMA guideline PDF, cover page and sections 1–4 and Appendix 1. Teorell introduced physiological multicompartment models in 1937 (Jones and Rowland-Yeo 2013).
Raising exposure: the human data
The often-quoted “2000%” for piperine comes from a 1998 study in ten healthy men given 2 g curcumin with or without 20 mg piperine. Serum curcumin after curcumin alone was undetectable or very low, so the percentage is relative to a baseline mostly below detection.
Later formulation studies report fold-increases in curcuminoids measured after enzymatic deconjugation, which counts glucuronide and sulfate metabolites with the parent. A higher plasma AUC is a pharmacokinetic result; it does not show an effect. Full comparison: what curcumin studies measured.
| Study | Design | What was measured | Reported result | Read with |
|---|---|---|---|---|
| Shoba et al. 1998: piperine co-dose | Ten healthy men; 2 g curcumin alone or with 20 mg piperine | Serum curcumin | “The increase in bioavailability was 2000%”; higher levels from 0.25 to 1 h | Baseline mostly undetectable. Piperine inhibits glucuronidation (authors) and, in vitro, P-gp (IC50 15.5 µM, digoxin transport) and CYP3A4 |
| Cuomo et al. 2011: phospholipid (lecithin) formulation | Randomized, double-blind, crossover; formulation versus unformulated curcuminoids | Plasma curcumin, demethoxycurcumin, bisdemethoxycurcumin | Total curcuminoid absorption about 29-fold higher | Only phase 2 metabolites were detected; the main plasma curcuminoid was demethoxycurcumin, not curcumin |
| Purpura et al. 2018: γ-cyclodextrin formulation | 12 healthy adults, double-blind crossover; four products | Total curcuminoids after β-glucuronidase/sulfatase hydrolysis, AUC0–12 h | 39.1-fold (γ-cyclodextrin), 8.5-fold (phytosome), 1.1-fold (turmeric-oil formulation) versus dose-normalized standard extract | Standard extract given at about 5× the dose, then normalized; financial support from Wacker Chemie AG |
Shoba G, et al. Planta Med 1998;64:353–356; Bhardwaj RK, et al. J Pharmacol Exp Ther 2002;302:645–650; Cuomo J, et al. J Nat Prod 2011;74:664–669; Purpura M, et al. Eur J Nutr 2018;57:929–938, Table 2.
Botanical–drug interactions
A botanical can change exposure to a co-administered drug by inducing or inhibiting the enzymes and transporters above. FDA grades potency with sensitive substrates: a strong inducer lowers their AUC by at least 80%, a moderate one by 50–80%, a weak one by 20–50%; a strong inhibitor raises AUC at least 5-fold, a moderate one 2- to 5-fold, a weak one 1.25- to 2-fold.
St John's wort induction tracks hyperforin dose, and FDA notes that its effect “varies widely and is preparation dependent.” Goldenseal raised oral midazolam AUC by about 40–60%, mainly by inhibiting intestinal CYP3A.
| Preparation and study | Subjects | Probe | Result |
|---|---|---|---|
| St John's wort, six products for 14 days (Mueller 2006) | 42 healthy men, six parallel groups | Oral midazolam 7.5 mg | AUC0–12 h: −79.4% (hyperforin 41 mg/day), −47.9% (12 mg/day), −21.1% (0.13 mg/day). Decrease correlated with hyperforin dose (r = −0.765), not hypericin dose (r = −0.067) |
| St John's wort 300, 900, 1800 mg/day for 14 days (Hohmann 2024) | 11 healthy volunteers | Oral midazolam 30 µg; intravenous 10 µg | Oral clearance 1.96-, 3.86- and 5.62-fold; intravenous clearance 2.05-fold at 1800 mg/day; 17.5-fold oral with rifampin added. Effects mainly in the gut |
| Goldenseal product (Nguyen 2021) | 16 healthy volunteers | Probe cocktail including midazolam | Midazolam AUC0–∞ ratio 1.43 (90% CI 1.35–1.53); no effect on rosuvastatin or furosemide; metformin AUC ratio 0.77 (0.71–0.83) |
| Goldenseal 3 g once, or 1 g three times daily for 6 days (Nguyen 2023) | Healthy adults | Oral midazolam | AUC and Cmax +40–60%, half-life up ≤ 23%; (−)-β-hydrastine the main precipitant; PBPK model within 20% of observed |
Mueller SC, et al. 2006; Hohmann N, et al. Clin Transl Sci 2024;17:e70007; Nguyen JT, et al. Clin Pharmacol Ther 2021; Nguyen JT, et al. J Pharmacol Exp Ther 2023;387:252–264; U.S. FDA interaction table (St John's wort listed as a strong CYP3A inducer, footnote 18).
Synergy, defined precisely
Two different things are both called synergy. A pharmacokinetic interaction changes exposure: one compound alters the absorption, metabolism or excretion of another, as piperine and St John's wort do. A pharmacodynamic interaction changes the response at a given exposure.
In pharmacology, synergy is a pharmacodynamic claim measured against a named model of no interaction. The 1992 Saariselkä agreement asks authors to say which: “Loewe synergy” or “Bliss synergy.”
| Term | Definition | How it is tested |
|---|---|---|
| Pharmacokinetic interaction | One agent changes the exposure (AUC, Cmax) to another | Clinical study with a probe substrate; FDA potency categories |
| Pharmacodynamic interaction | The combined response differs from the response expected without interaction | Dose–response curves for each agent alone and in combination |
| Loewe additivity | Each agent acts as a dilution of the other; a combination is additive when dA/DA + dB/DB = 1 | Isobologram: the additive isobole is a straight line when relative potency is constant |
| Combination index (Chou–Talalay) | CI = dA/DA + dB/DB; CI < 1 synergism, = 1 additive, > 1 antagonism | Median-effect analysis of single-agent and mixture dose–effect data |
| Bliss independence | Agents act independently; expected fractional effect EA + EB − EA·EB | Compare observed with expected response at each dose pair |
Tang J, Wennerberg K, Aittokallio T. Front Pharmacol 2015;6:181; Tallarida RJ. J Pharmacol Exp Ther 2006;319:1–7; Chou T-C. Pharmacol Rev 2006;58:621–681; Greco WR, Bravo G, Parsons JC. Pharmacol Rev 1995;47:331–385. DA, DB: doses of each agent alone giving the chosen effect; dA, dB: their doses in the mixture giving the same effect.
Where EUTECNIQ would work
EUTECNIQ would characterize botanical constituents for the properties in section 3, measure exposure as parent compound and conjugates, and screen extracts against CYP3A and transporter probes before any human study. PBPK work would use qualified platforms and published physiology. None of this exists yet.
Related pages: Bioavailability design · Evidence and pharmacokinetics · Translational research · Combination science · Dosage forms
Health information notice
These statements have not been evaluated by the Food and Drug Administration. Nothing on this site is intended to diagnose, treat, cure or prevent any disease. The information is for general education only. It is not medical advice and does not replace advice, diagnosis or treatment from a qualified health professional, or any medication a clinician has prescribed.
Do not start, stop or change any medicine, supplement or herbal product because of something you read here. Talk to your doctor or pharmacist first, especially if you are pregnant or breastfeeding, have a medical condition, take any medicines, are preparing for surgery, or are caring for a child. Research findings, traditional uses and safety data are reported as their sources state them; they are not recommendations or claims about any product. If you think you may have a medical emergency, call your doctor or 911 at once.
EUTECNIQ Sciences sells no supplements or health products today and receives nothing from any product or ingredient mentioned on this site; any commercial interest it later has in an ingredient will be stated on that ingredient’s page.