

How digestion works, from the mouth to the colon
What each part of the gut secretes, which enzymes split food and how they are switched on, which hormones coordinate the process, and which transporters carry each nutrient into the body. The last sections cover colonic fermentation, the physics of stomach mixing and the standard laboratory digestion method.
Patricia JJ, Dhamoon AS. Physiology, Digestion. StatPearls, updated September 12, 2022; UniProt P13866 (SLC5A1); Sender R, Fuchs S, Milo R. PLoS Biol 2016;14:e1002533; den Besten G, et al. J Lipid Res 2013;54:2325–2340.
Status. Education, not medical advice. EUTECNIQ is in formation and runs no laboratory or studies. The gastric-emptying curve on this page is an educational calculation, not a measurement or a prediction for any product.
Related: ADME, PK and PBPK · Proteins, peptides and collagen · Dosage forms · Bioavailability design
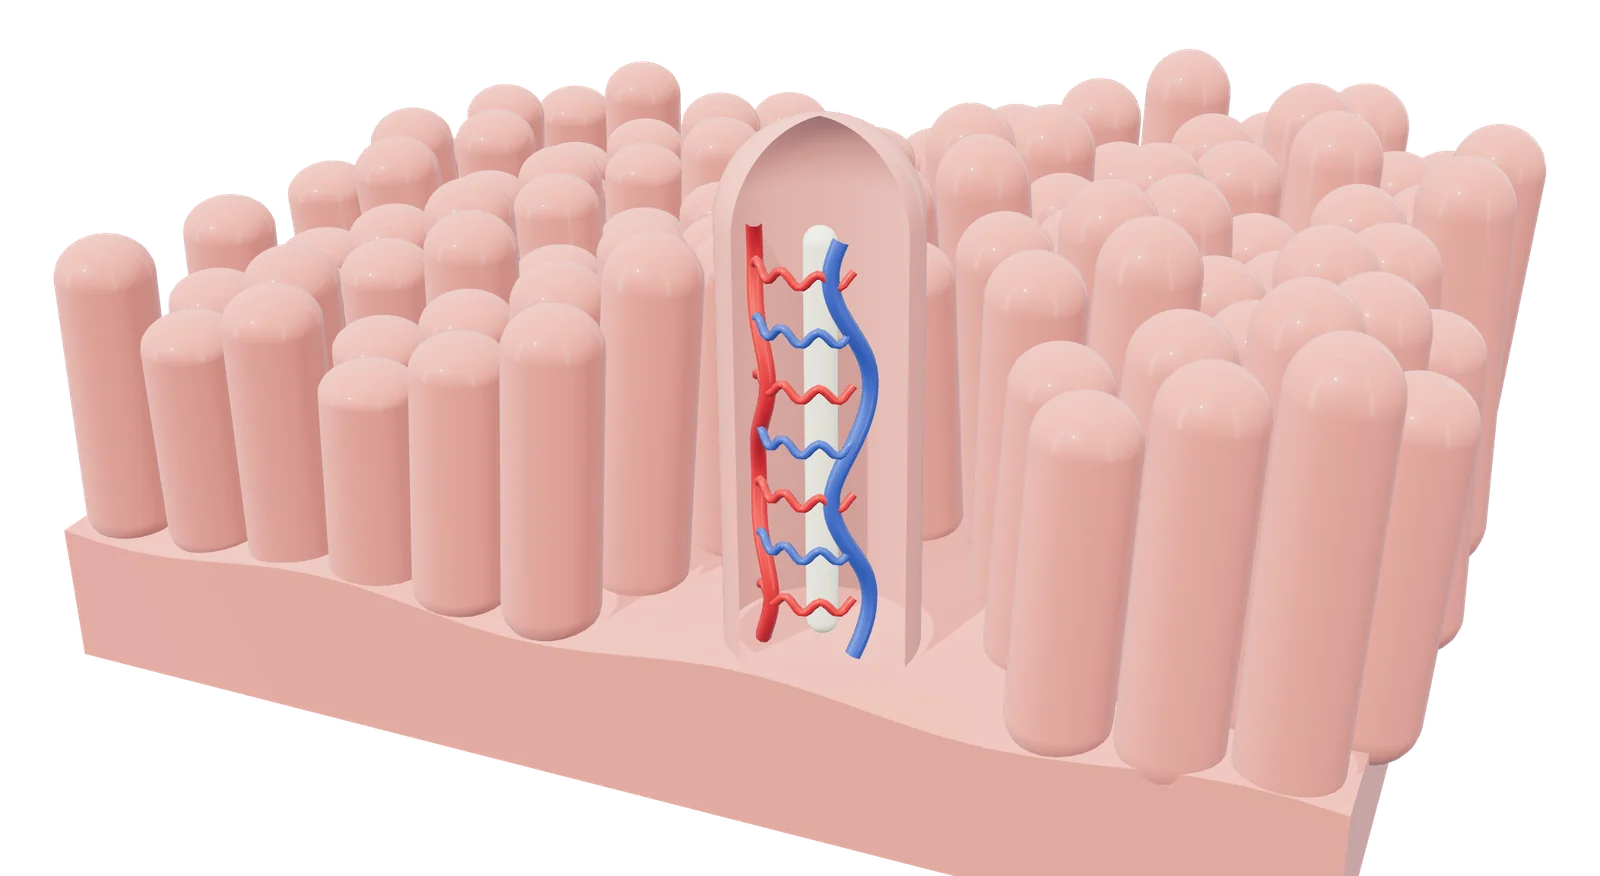
- 1 Villi line the small intestine
- 2 Capillaries carry absorbed nutrients to the portal vein
- 3 Lacteal takes up fats into the lymph
Rendered by EUTECNIQ; generalized and not to scale.
Each part of the gut has its own secretions, acidity and transit time
Food passes through a tube about 5 m long whose acidity swings from strongly acid in the stomach to near neutral in the intestine. Glands outside the tube, the salivary glands, liver and pancreas, empty their secretions into it.
Most digestion and absorption happen in the small intestine; the colon holds its contents for about 36 hours in men and adds bacterial fermentation.
Text version of the drawing, with sources
| Part | Secretes or does | Luminal pH, mean (SD) | Transit, adult male |
|---|---|---|---|
| Mouth | Saliva with salivary α-amylase from the salivary glands; lingual lipase from the lingual glands | Not measured in this dataset | Solids 15 s; liquids 2 s |
| Esophagus | Carries the bolus; 28 cm long | — | Solids 8 s |
| Stomach | Parietal cells: HCl and intrinsic factor. Chief cells: pepsinogen and gastric lipase. G cells: gastrin. D cells: somatostatin. Surface mucous cells: mucus and bicarbonate | 1.0–2.5 (range, all subjects) | Solids 75 min; caloric liquids 45 min; non-caloric liquids 30 min |
| Liver and gallbladder | Liver makes bile acids from cholesterol and secretes bile; the gallbladder stores and concentrates bile and contracts after cholecystokinin release | — | — |
| Pancreas | Acinar cells: amylase, lipase and colipase, and protease precursors. Bicarbonate-rich fluid under secretin | — | — |
| Duodenum | Receives bile and pancreatic juice; enteropeptidase on the brush border; iron and calcium absorbed | 6.6 (0.5), proximal small intestine, first hour | Small intestine 4 h in total |
| Jejunum | Most carbohydrate and protein absorbed | — | (within the 4 h) |
| Ileum | Terminal ileum absorbs vitamin B12 bound to intrinsic factor, and bile acids | 7.5 (0.4), terminal ileum | (within the 4 h) |
| Cecum and ascending colon | Bacterial fermentation of fiber | 6.4 (0.4), cecum | Right colon 12 h |
| Transverse, descending and sigmoid colon | Water absorbed by osmosis; sodium absorbed actively; potassium absorbed or secreted | 7.0 (0.7), left colon | Left colon 12 h |
| Rectum | Holds feces until defecation | — | Rectosigmoid 12 h |
Evans DF, et al. Gut 1988 (pH); ICRP Publication 89 (2002), Tables 2.11 and 2.37 (lengths, transit; women: stomach solids 105 min, each colon segment 16 h); Hsu M, et al. Physiology, Stomach. StatPearls, updated July 17, 2023; Chen I, Cassaro S. Physiology, Bile Acids. StatPearls, updated May 1, 2023; Azzouz LL, Sharma S. Physiology, Large Intestine. StatPearls, updated July 31, 2023; Betts JG, et al. OpenStax Anatomy and Physiology 2e, §23.7 (absorption sites). Luminal pH and transit vary between people and with meals.
Digestion is hydrolysis by enzymes from four sources, and the proteases are made inactive
Enzymes come from the salivary glands, the stomach's chief cells, the pancreatic acinar cells and the brush border, the microvillus surface of the intestinal lining cells (enterocytes). Each splits a bond with water. The pancreas secretes its proteases as inactive precursors (zymogens), so it does not digest itself.
Pepsin works in the acid stomach and stops in the near-neutral duodenum, where the pancreatic enzymes and brush-border enzymes take over.
Table of digestive enzymes: source, substrate, products, activation and pH optimum
| Enzyme (gene, EC number) | Secreted by | Substrate and bond | Products | Activation | pH optimum, where a source states it |
|---|---|---|---|---|---|
| Salivary α-amylase (AMY1A, EC 3.2.1.1) | Salivary glands | Starch: internal α-1,4 glucosidic bonds | Maltose, isomaltose, small amounts of glucose, small linear and branched dextrins | Calcium-binding enzyme; no precursor listed | 6.7–7.0 (StatPearls, Physiology, Digestion) |
| Lingual (salivary) lipase | Lingual glands; present in saliva | Triglyceride ester bonds | Free fatty acids, mono- and diglycerides | — | Not stated. INFOGEST notes that the lipase acting before the duodenum is gastric lipase in humans and lingual lipase in rodents |
| Pepsin (pepsin A, PGA3, EC 3.4.23.1) | Gastric chief cells, as pepsinogen | Proteins; prefers hydrophobic, preferably aromatic, residues on either side of the bond | Peptides | Pepsinogen is activated by HCl or by pepsin itself | Most effective at about pH 1.5–2; inactive as pH rises above 6 |
| Gastric lipase (LIPF, EC 3.1.1.3) | Chief cells of the oxyntic glands, body of the stomach | Triglycerides, preferring the sn-3 position | Free fatty acids and diacylglycerols (also monoacylglycerols, glycerol) | Resists pepsin; not inhibited by bile salts | 4–5.4; stable and active from pH 2 to 7 |
| Pancreatic α-amylase (AMY2A, EC 3.2.1.1) | Pancreatic acinar cells | Starch: internal α-1,4 bonds | α-Dextrins, maltose, maltotriose | Present in the pancreas in active form | Not stated in the sources used |
| Pancreatic lipase (PNLIP, EC 3.1.1.3) | Pancreatic acinar cells | Emulsified triglycerides; esters at positions 1 and 3 | 2-Monoacylglycerol and free fatty acids | Active, but inhibited by bile salts; reactivated by colipase | 7 |
| Colipase (CLPS; cofactor, no EC number) | Pancreas | Binds lipase at the lipid–water interface | None; it lets lipase stay on the droplet surface | Without colipase, bile salts wash lipase off the interface | — |
| Phospholipase A2 (PLA2G1B, EC 3.1.1.4) | Pancreas | Dietary phospholipids, fatty acyl ester at sn-2; calcium-dependent | Lysophospholipid and a fatty acid | Trypsin cleavage in the duodenum | Not stated in the sources used |
| Cholesterol esterase: bile salt-activated lipase (CEL, EC 3.1.1.13) | Pancreas (also the mammary gland) | Cholesteryl esters; also phospholipids, lysophospholipids, di- and triacylglycerols | Cholesterol and fatty acids | Activated by bile salts | Not stated in the sources used |
| Trypsin (PRSS1, EC 3.4.21.4) | Pancreatic acinar cells, as trypsinogen | Proteins, after arginine or lysine | Peptides | Enteropeptidase removes an N-terminal hexapeptide | Not stated in the sources used |
| Chymotrypsin (CTRB1, EC 3.4.21.1) | Acinar cells, as chymotrypsinogen | Proteins, after tyrosine, tryptophan, phenylalanine or leucine | Peptides | Trypsin | — |
| Elastases (CELA2A, EC 3.4.21.71; CELA3A, EC 3.4.21.70) | Acinar cells, as proelastases | CELA2A: after leucine, methionine or phenylalanine, and hydrolyzes elastin. CELA3A: after alanine, with little elastolytic activity | Peptides | Trypsin | — |
| Carboxypeptidases A1 (CPA1, EC 3.4.17.1) and B (CPB1, EC 3.4.17.2) | Acinar cells, as procarboxypeptidases | The C-terminal amino acid. A: little or no action on Asp, Glu, Arg, Lys, Pro. B: lysine or arginine | Free amino acids and shorter peptides | Trypsin | — |
| Nucleases (ribonuclease, deoxyribonuclease) | Pancreatic acinar cells | RNA, DNA | Nucleotides, then pentoses, phosphate and bases by brush-border nucleosidases and phosphatases | — | — |
| Enteropeptidase (TMPRSS15, EC 3.4.21.9) | Duodenal brush border | Trypsinogen, at the Lys6–Ile7 bond | Trypsin | Starts the pancreatic protease cascade | — |
| Lactase: lactase-phlorizin hydrolase (LCT, EC 3.2.1.108) | Enterocyte brush border; specific to the small intestine | Lactose | Glucose and galactose | Membrane-bound (brush border) | — |
| Sucrase-isomaltase (SI; EC 3.2.1.48 and 3.2.1.10) | Brush border of crypt and villus cells | Sucrase: sucrose, and part of maltose hydrolysis. Isomaltase: α-1,6 bonds, including isomaltose and branch points of starch fragments (textbook “α-dextrinase”) | Glucose and fructose; glucose | Cut into two subunits that stay together on the membrane | — |
| Maltase-glucoamylase (MGAM, EC 3.2.1.20) | Brush border; highly expressed in the small intestine | Short linear oligomaltoses of two to seven glucose units, from the non-reducing end | Glucose | Not proteolytically processed | 7, with substantial activity at acidic pH |
| Trehalase (TREH, EC 3.2.1.28) | Small intestine (also kidney and liver) | Trehalose | Two glucose | Membrane-bound | — |
| Aminopeptidase N (ANPEP, EC 3.4.11.2) | Intestinal epithelial cell membrane | The N-terminal amino acid, preferably alanine | Amino acids and shorter peptides | Membrane-bound | — |
| Dipeptidases | Brush border | Dipeptides | Amino acids | — | — |
UniProtKB/Swiss-Prot human entries, retrieved October 29, 2026: P0DUB6, P0DJD8, P07098, P04746, P16233, P04118, P04054, P19835, P07477, P17538, P08217, P09093, P15085, P15086, P98073, P09848, P14410, O43451, O43280, P15144. Patricia JJ, Dhamoon AS. Physiology, Digestion. StatPearls, 2022 (lingual lipase in saliva; gastric lipase from chief cells of the body; pepsinogen autoactivation); Heda R, et al. Physiology, Pepsin. StatPearls, 2023; Brodkorb A, et al. Nat Protoc 2019 (gastric lipase); Pandol SJ. The Exocrine Pancreas, 2010; Betts JG, et al. OpenStax Anatomy and Physiology 2e, Table 23.8 (sources, products, nucleases, dipeptidase). A dash means no source used here states it.
Lactase-phlorizin hydrolase also removes glucose from several plant flavonoid glucosides, such as quercetin 4′-O-glucoside, in enzyme assays recorded in UniProt (P09848). This is an in vitro enzyme activity, not a measure of how much of any flavonoid a person absorbs.
Secretions that are not enzymes: acid, intrinsic factor, bile acids and bicarbonate
| Secretion | Made by | Role and control |
|---|---|---|
| Hydrochloric acid | Gastric parietal cells | Secreted at about 160 mmol/L and pH 0.8. Gastrin binds CCK-B receptors on parietal cells and raises H⁺/K⁺-ATPase expression and activity; gastrin also makes enterochromaffin-like cells release histamine, which acts on parietal-cell H2 receptors |
| Intrinsic factor (CBLIF) | Gastric parietal cells | Binds vitamin B12; the complex is taken up in the ileum through the cubilin–amnionless receptor by endocytosis |
| Bile acids | Liver (hepatocytes), from cholesterol; stored and concentrated in the gallbladder | About 95% of synthesis runs through the classic pathway, whose rate-limiting step is cholesterol 7α-hydroxylase (CYP7A1). Primary bile acids (cholic, chenodeoxycholic) are conjugated with glycine or taurine; colonic bacteria make secondary bile acids (deoxycholic, lithocholic). Cholecystokinin contracts the gallbladder. Bile acids form micelles and are reabsorbed by active transport in the terminal ileum by the sodium/bile acid cotransporter ASBT (SLC10A2) |
| Bicarbonate | Pancreatic ducts, bile ducts, duodenal Brunner glands; gastric surface mucous cells | Secretin raises pancreatic and biliary bicarbonate secretion, which neutralizes acid entering the duodenum |
Patricia JJ, Dhamoon AS. StatPearls, 2022 (HCl concentration and pH); Prosapio JG, et al. Physiology, Gastrin. StatPearls, updated April 6, 2023; Hsu M, et al. Physiology, Stomach. StatPearls, 2023; UniProt P27352 (CBLIF), O60494 (CUBN), Q9BXJ7 (AMN), Q12908 (SLC10A2); Chen I, Cassaro S. Physiology, Bile Acids. StatPearls, 2023; DiGregorio N, Sharma S. Physiology, Secretin. StatPearls, updated May 1, 2023.
Scattered endocrine cells in the gut lining coordinate secretion, motility and appetite
Enteroendocrine cells sit singly among the lining cells. Each type senses a stimulus in the lumen, such as acid, fat or sugar, and releases a hormone into the blood or onto neighboring cells. Their positions along the gut decide which signal comes first.
| Hormone | Cell and location | Stimulus for release | Main actions |
|---|---|---|---|
| Gastrin | G cells, mainly the pyloric antrum; also the duodenum | Vagal stimulation through gastrin-releasing peptide; peptides and amino acids; distension; a higher gastric pH. Reduced by somatostatin and by a falling gastric pH | Gastric acid secretion; gastric mucosal growth and motility |
| Cholecystokinin (CCK) | I cells, duodenum and jejunum | Fatty acids and monoglycerides (not triglycerides); protein digestion products | Gallbladder contraction with relaxation of the sphincter of Oddi; pancreatic enzyme secretion; regulates gastric emptying; established as an endocrine control of eating in healthy-weight people |
| Secretin | S cells, duodenum | Acid (H⁺) and fatty acids in the duodenum | Raises pancreatic and biliary bicarbonate; lowers gastric acid secretion and inhibits gastrin |
| GIP (glucose-dependent insulinotropic peptide) | K cells, duodenum and jejunum | Glucose, amino acids, fatty acids | Stimulates insulin secretion |
| GLP-1 (glucagon-like peptide-1) | L cells, distal small intestine and colon | Hexoses and fat | Slows gastric emptying; raises the glucose sensitivity of pancreatic β-cells; the only one of the four hormones reviewed by Steinert et al. that clearly contributes to endocrine control of meal-related glucose. Rapidly degraded in the circulation |
| Peptide YY (PYY) | L cells, distal small intestine and colon | Fat; released after meals in proportion to their calorie content | In humans, infusion of PYY(3-36) at normal after-meal concentrations cut food intake by 33% over 24 h |
| Ghrelin | A (X-like) cells, body (corpus) of the stomach | Not stated in the sources used. Plasma levels rose nearly twofold just before each meal and fell to a trough within 1 h after eating (10 healthy people) | Appetite-stimulating (orexigenic) peptide; the before-meal rise supports a role in starting meals |
| Motilin | Mo cells, upper small intestine (duodenum and jejunum) | Listed with gastrin as released by neural stimulation | Mediates phase III of the fasting (interdigestive) migrating motor complex in the human stomach |
| Somatostatin | D cells, pyloric region of the stomach and proximal small intestine; δ-cells, about 5% of pancreatic islet cells | Acidity of the stomach lumen | Suppresses gastrin; inhibits gastric acid, bile, pancreatic enzymes, CCK, secretin, insulin and glucagon |
Parikh A, Thevenin C. StatPearls, 2023; Prosapio JG, et al. Physiology, Gastrin. StatPearls, 2023; Okonkwo O, et al. Biochemistry, Cholecystokinin. StatPearls, updated May 1, 2023; DiGregorio N, Sharma S. Physiology, Secretin. StatPearls, 2023; Steinert RE, et al. Physiol Rev 2017;97:411–463 (abstract); Holst JJ. J Physiol 2024;602:6613–6629 (abstract); Batterham RL, et al. Nature 2002;418:650–654; Cummings DE, et al. Diabetes 2001;50:1714–1719; Kitazawa T, Kaiya H. Front Endocrinol 2021;12:700884; O'Toole TJ, Sharma S. Physiology, Somatostatin. StatPearls, updated July 24, 2023; Hsu M, et al. StatPearls, 2023 (D cells activated by gastric acidity); Rezzani R, et al. 2022.
Sugars and amino acids go to the liver by blood; fat goes to the lymph inside chylomicrons
Water-soluble products need a carrier protein in the cell membrane, because the lipid membrane blocks them and tight junctions close the gaps between cells. They enter the villus capillaries and travel in the portal vein to the liver. Long-chain fats are rebuilt inside the cell and leave through the lacteal, a lymph vessel.
Triglycerides leave the intestine only in chylomicrons; short-chain fatty acids and glycerol diffuse into the blood instead.
Carriers for carbohydrate, protein and fat, with sources
| Carrier or step | Nutrient | Membrane and mechanism |
|---|---|---|
| SGLT1 (SLC5A1) | Glucose, galactose | Apical brush border. Moves 2 Na⁺ with each sugar, driven by the Na⁺ gradient that the Na⁺/K⁺ pump maintains |
| GLUT5 (SLC2A5) | Fructose | Apical membrane of jejunal villi; facilitated diffusion; essential for intestinal fructose uptake |
| GLUT2 (SLC2A2) | Glucose, galactose, fructose | Basolateral exit from the enterocyte |
| PepT1 (SLC15A1) | Peptides of two to four amino acids, preferring dipeptides | Apical; proton-coupled (H⁺ to peptide 1:1 or 2:1); absorbed peptides are split into amino acids inside the cell |
| B⁰AT1 (SLC6A19) | Neutral amino acids | Apical; sodium-dependent; needs ACE2 for surface expression in the intestine |
| b⁰,⁺AT with rBAT (SLC7A9 with SLC3A1) | Cationic amino acids and cystine | Apical exchanger, taking them up for intracellular neutral amino acids; UniProt describes its role at the kidney brush border and lists expression in the small intestine |
| SIT1 (SLC6A20) | Proline and other imino acids, glycine | Apical membrane of villus enterocytes; Na⁺- and Cl⁻-dependent |
| LAT2 and y⁺LAT1 with 4F2hc (SLC7A8, SLC7A7 with SLC3A2) | Neutral and cationic amino acids | Basolateral exchangers |
| Micelles | Long-chain fatty acids, monoacylglycerols, cholesterol, fat-soluble vitamins A, D, E and K | Bile salts and lecithin carry them between the microvilli to the cell surface, where they diffuse in |
| NPC1L1 | Cholesterol | Apical; critical for cholesterol uptake; the target of the drug ezetimibe |
| FATP4 (SLC27A4) | Long-chain fatty acids | Annotated in UniProt as appearing to be the principal fatty-acid transporter of small-intestinal enterocytes |
| Re-esterification and MTP | Triglyceride, phospholipid, cholesteryl ester | Inside the cell fatty acids are rebuilt into triglyceride; MTP is required to assemble apoB-48 chylomicrons. In gene-ablation studies, loss of MTP abolished triglyceride absorption |
| Lacteal and lymph | Chylomicrons | Too large for blood capillaries, chylomicrons enter lacteals and reach the blood through the thoracic duct; in the blood, lipoprotein lipase releases fatty acids and glycerol |
| Simple diffusion | Short-chain fatty acids, glycerol | Into villus capillary blood, then the portal vein |
UniProt entries retrieved October 29, 2026: P13866, P22732, P11168, P46059, Q695T7, P82251, Q07837, Q9NP91, Q9UHI5, Q9UM01, Q9UHC9, Q6P1M0, P55157, P04114; Betts JG, et al. OpenStax Anatomy and Physiology 2e, §23.7 (micelles, chylomicrons, lacteals, diffusion of short-chain fatty acids and glycerol; most carbohydrate and protein absorption in the jejunum; 95 to 98% of protein and about 95% of lipid absorbed in the small intestine); Hussain MM. Curr Opin Lipidol 2014 (abstract). Protein quality and peptide absorption: Proteins, peptides and collagen. The intestinal lymph route for lipophilic compounds: ADME, PK and PBPK; chylomicron composition and lymph transport: Blood and lymph.
Several vitamins and minerals depend on one carrier in one segment of the intestine
At dietary intakes most water-soluble vitamins are absorbed by specific carriers, with passive diffusion contributing mainly at high doses; fat-soluble vitamins travel in micelles. A few nutrients depend on a dedicated carrier found mainly in one segment, so losing that segment or that carrier affects that nutrient in particular.
| Nutrient | Pathway | Published numbers and regulation |
|---|---|---|
| Vitamin B12 | Acid and gastric protease free B12 from food; it binds haptocorrin from saliva; digestive enzymes in the duodenum free it, and it binds intrinsic factor; the complex is taken up in the distal ileum by receptor-mediated endocytosis through cubilin and amnionless | From supplements, about 50% is absorbed at doses below 1–2 mcg, about 2% at 500 mcg and 1.3% at 1,000 mcg |
| Iron | The reductase DCYTB probably turns Fe³⁺ into Fe²⁺ at the duodenal brush border; DMT1 (SLC11A2) carries Fe²⁺ in with one proton; ferroportin (SLC40A1) exports it at the base, and hephaestin oxidizes it back to Fe³⁺ for transferrin | Hepcidin from the liver degrades ferroportin and is the key regulator of absorption. Bioavailability is about 14–18% from mixed diets and 5–12% from vegetarian diets. Ascorbic acid and meat raise nonheme-iron absorption; phytate and some plant polyphenols lower it |
| Calcium | Active transcellular route regulated by 1,25-dihydroxyvitamin D (vitamin D): entry through the TRPV6 channel, binding to calbindin-D9k, exit by the PMCA1b pump. Passive paracellular route through tight junctions | Mouse knockouts absorbing calcium without TRPV6 and calbindin-D9k have challenged the traditional transcellular model. The paracellular route predominates in the distal intestine when dietary calcium is high |
| Folate | Proton-coupled folate transporter PCFT (SLC46A1) at the brush border of the proximal jejunum; works at acidic pH | Expression highest in the duodenum and jejunum and undetectable in the lowest ileum |
| Vitamin C | Sodium-ascorbate cotransporter SVCT1 (SLC23A1) | 2 Na⁺ per ascorbate; highly expressed in the adult small intestine |
| Zinc | ZIP4 (SLC39A4) on the apical membrane | Zinc deficiency moves ZIP4 to the cell surface; high zinc makes the cell take it back in |
| Vitamins A, D, E and K | Carried in micelles with dietary fat, then in chylomicrons | Absorbed along with dietary lipids |
NIH Office of Dietary Supplements. Vitamin B12 fact sheet for health professionals, updated March 26, 2024; Iron fact sheet for health professionals; UniProt Q53TN4 (CYBRD1), P49281 (SLC11A2), Q9NP59 (SLC40A1), Q9BQS7 (HEPH), P81172 (hepcidin), O60494 (CUBN), Q9BXJ7 (AMN), Q96NT5 (SLC46A1), Q9UHI7 (SLC23A1), Q6P5W5 (SLC39A4), Q9H1D0 (TRPV6); Christakos S. JBMR Plus 2021;5:e10554; OpenStax Anatomy and Physiology 2e, §23.7.
Colonic bacteria ferment undigested fiber into short-chain fatty acids that the body absorbs
Indigestible plant fiber, such as cellulose, passes the small intestine and reaches the colon. There, bacteria at about 10¹¹ per milliliter ferment dietary fiber into short-chain fatty acids (SCFA), mainly acetate, propionate and butyrate. The colon absorbs almost all of them.
The proportions of the three acids change from colon to portal to hepatic blood, indicating greater uptake of butyrate by the colonic lining and of propionate by the liver.
Show data and details: bacteria, SCFA and colonic transport
| Region | Bacteria per mL of content | Content volume, mL |
|---|---|---|
| Stomach | 10³–10⁴ | 250–900 |
| Duodenum and jejunum | 10³–10⁴ | 400 |
| Ileum | 10⁸ | 400 |
| Colon | 10¹¹ | 400 |
| Site | Total SCFA | pH |
|---|---|---|
| Terminal ileum | 13 ± 6 mmol/kg | — |
| Cecum | 131 ± 9 mmol/kg | 5.6 ± 0.2 |
| Descending colon | 80 ± 11 mmol/kg | 6.6 ± 0.1 |
| Portal vein | 375 ± 70 µmol/L | — |
| Hepatic vein | 148 ± 42 µmol/L | — |
| Peripheral vein | 79 ± 22 µmol/L | — |
Acetate was the principal SCFA in every sample Cummings et al. measured. The molar ratio of acetate, propionate and butyrate in the large intestine of six sudden-death victims was 57:22:21. About 95% of the SCFA produced are absorbed by colonocytes and about 5% are excreted in feces. Colonocytes take them up through the apical carriers MCT1 (SLC16A1) and SMCT1 (SLC5A8); at a luminal pH near 6 too little SCFA is undissociated for passive diffusion to play a major role. Colonocytes are often described as depending largely on butyrate for energy; from uptake measurements in isolated human and rat colonocytes, den Besten et al. conclude that acetate is at least as important as butyrate for their energy supply.
The colon also absorbs water by osmosis and sodium by active transport, and colonic bacteria synthesize vitamin K and B vitamins such as biotin. The cecal pH at autopsy (5.6) is lower than the cecal pH measured by telemetry capsule in living subjects (6.4); the methods differ.
Sender R, et al. 2016; Cummings JH, et al. 1987; den Besten G, et al. J Lipid Res 2013;54:2325–2340; Azzouz LL, Sharma S. StatPearls, 2023; Evans DF, et al. 1988; Betts JG, et al. OpenStax Anatomy and Physiology 2e, §23.7 (indigestible fiber such as cellulose reaches the large intestine). Related entries: Probiotics (live microorganisms; effects depend on the strain) and Psyllium (a soluble fiber).
A solid meal leaves the stomach after a lag, then at a nearly steady rate
Scintigraphy follows a radiolabeled meal with a gamma camera. In 189 healthy Thai adults given a 267 kcal meal of rice and labeled egg, half the meal had left in a median of 68.7 min. The modified power-exponential equation describes the curve with two parameters.
The early flat segment is the lag phase; Siegel et al. attribute it to the stomach reducing solid food to particles small enough to pass the pylorus.
Show data, equations and limits
| Time, min | Published median retention, % | 5th–95th percentile, % | Calculated, % |
|---|---|---|---|
| 30 | 88.3 | 68.4–97.9 | 87.5 |
| 60 | 61.8 | 33.2–86.3 | 58.1 |
| 90 | 35.6 | 9.6–71.1 | 33.4 |
| 120 | 16.3 | 2.7–49.8 | 18.0 |
| 180 | 3.4 | 0.4–20.5 | 4.8 |
| 240 | 1.1 | 0.2–8.8 | 1.2 |
Equation: fractional retention y(t) = 1 − (1 − e−kt)β, where k is the emptying rate (min−1) and β the extrapolated y-intercept of the terminal part of the curve. The study computed lag time = ln β/k − (β − 1)/(kβ) and T½ = −ln(1 − 0.51/β)/k. Solving both for the medians gives k = 0.0228 min−1 and β = 2.97.
Medians of individual parameters do not define a median curve exactly, so the calculated curve is an approximation. Women emptied more slowly than men (median T½ 74.0 against 63.1 min). Siegel et al. found the lag phase and half-emptying time lengthen with food density: 31 ± 8 and 77.6 ± 11.2 min for egg, 62 ± 16 and 94.1 ± 14.2 min for chicken liver, in 24 volunteers.
Vasavid P, et al. 2014 (methods and Table); Siegel JA, et al. 1988 (abstract).
Simulations show the antrum does the mixing, and viscous meals mix poorly
About three times a minute a ring of contraction travels down the lower stomach (antrum) toward the pylorus. Computational fluid dynamics (CFD), the numerical solution of the equations of fluid motion, shows what this wave does to the contents.
| Study | What was modeled | Findings |
|---|---|---|
| Pal et al., Proc R Soc B 2004 | Two-dimensional lattice-Boltzmann model of the stomach, geometry from MRI, volume changes matched to liquid emptying | Two fluid motions: retrograde jets through the contraction waves and circulation between waves. Mixing confined to the antrum and enhanced by more and narrower waves. Simulated peristaltic pressure waves in the distal antrum were consistent with manometry but much lower in amplitude, which the authors take to mean that manometric amplitudes reflect the catheter touching the gastric wall |
| Ferrua and Singh, J Food Sci 2010 | Three-dimensional model of an average stomach (Fluent); waves every 20 s from 15 cm above the pylorus, 58 s life, up to 80% occlusion; Newtonian contents of 1 mPa·s and 1 Pa·s, density 1 kg/L | Jet appears once occlusion reaches 56% and peaks at 7.6 cm/s in the pyloric canal. At 1 Pa·s the jet is faster but confined (11.9 against 7.5 cm/s; 0.2 against 2.3 cm long), eddies weaken and pressure differences grow by up to three orders of magnitude, so viscous meals mix poorly |
| Kozu et al., Food Funct 2014 | Human gastric flow simulator with deforming walls, measured by particle image velocimetry and compared with CFD | Maximum flow velocity 9 mm/s in the occluded region at a wave speed of 2.5 mm/s; flow laminar, maximum Reynolds number 125; maximum shear rate below 20 s−1; viscosity from 1 to 100 mPa·s hardly changed the maximum velocity |
| Seo and Mittal, Front Physiol 2021 | Image-based stomach with a moving tablet: fluid–structure interaction and mass transport; waves at 2.3 mm/s, every 20 s, 20 mm wide, maximum contraction parameter 0.7 | The retropulsive jet and antral recirculation govern tablet motion and mixing of dissolved drug; gastric flow raises the dissolution flux when the tablet moves relative to the fluid |
Pal A, et al. Proc R Soc Lond B 2004;271:2587–2594 (abstract); Ferrua MJ, Singh RP. J Food Sci 2010 (full text); Kozu H, et al. Food Funct 2014;5:1839–1847 (abstract); Seo JH, Mittal R. Front Physiol 2021;12:755997.
The Reynolds number, and the laminar flow in a gastric flow simulator
The Reynolds number compares inertia with viscosity. For flow in a tube it is NR = 2ρvr/η, with fluid density ρ, speed v, tube radius r and viscosity η. In tubes, flow is laminar below about 2,000 and turbulent above about 3,000.
Kozu et al. report that the flow in their gastric flow simulator was laminar, with a maximum Reynolds number of 125. In the simulation of Ferrua and Singh, a 1,000-fold rise in viscosity confined the retropulsive jet and weakened the eddies.
Ling SJ, Sanny J, Moebs W. University Physics Volume 1. OpenStax, 2016, §14.7, Eq. 14.20; Kozu H, et al. 2014; Ferrua MJ, Singh RP. 2010.
Show data: antral contraction wave and jet
| Quantity | Value |
|---|---|
| Wave frequency | About 3 per minute; on average one every 20 s |
| Origin | About 14.4 cm from the pylorus |
| Width and speed | 1.8 cm; 0.25 cm/s |
| Relative occlusion | 0 to 40% over 17.5 s; 40% for 16 s; then rising over 24 s to up to 90% at the pylorus |
| Jet, 1 mPa·s contents | Initial velocity 7.5 cm/s; length 2.3 cm |
| Jet, 1 Pa·s contents | Initial velocity 11.9 cm/s; length 0.2 cm |
Ferrua MJ, Singh RP. 2010 (wave parameters from Pal et al. 2004 and 2007, as summarized there; Table 2).
INFOGEST sets one static recipe for oral, gastric and intestinal digestion in the laboratory
The INFOGEST network published a harmonized static method so that laboratories digest foods under the same conditions. Each phase dilutes the sample 1:1 with a simulated fluid, adds enzymes at fixed activities and holds pH, time and temperature constant.
A static digestion shows what is released from a food in the tube (bioaccessibility); it does not measure absorption into the blood (systemic bioavailability).
Conditions, enzyme options and limits
| Phase | Dilution | Enzymes, final activity | pH, time |
|---|---|---|---|
| Oral | Food 1:1 (w/w) with simulated salivary fluid, to a paste no thicker than tomato paste | Salivary α-amylase 75 U/mL, only for foods with starch | pH 7; 2 min |
| Gastric | Bolus 1:1 (v/v) with simulated gastric fluid | Pepsin 2,000 U/mL; gastric lipase 60 U/mL (rabbit gastric extract recommended; its pepsin counts toward the total) | pH 3.0; 2 h |
| Intestinal | Chyme 1:1 (v/v) with simulated intestinal fluid | Pancreatin dosed to trypsin 100 U/mL, or single enzymes: trypsin 100, chymotrypsin 25, α-amylase 200, lipase 2,000 U/mL with colipase in molar excess; bile salts 10 mM | pH 7; 2 h |
All phases run at 37 °C. The authors recommend assaying enzyme activities for each new batch; the protocol gives assays for α-amylase, pepsin, trypsin, chymotrypsin, pancreatic and gastric lipase and bile salts. The 60 U/mL gastric lipase is half the 120 U/mL measured in human gastric juice, matching the 1:1 dilution. Gastric lipolysis accounts for 10% (solid–liquid meal) to 25% (emulsified liquid meal) of triglyceride digestion. Pepsin is stopped by raising the pH to 7.0 or with pepstatin A.
Limits stated by the authors: static methods do not reproduce pH gradients, gradual addition of enzymes and fluid, or continuous gastric emptying; dynamic and semi-dynamic models exist for that. After casein and whey ingestion, INFOGEST intestinal digests shared a high number of identical peptide sequences with human jejunal samples.
Brodkorb A, et al. 2019.
Where EUTECNIQ would use this
EUTECNIQ would use the INFOGEST method to measure how much of a botanical constituent is released during simulated digestion, and would report such results as bioaccessibility, not bioavailability. None of this work has started.
Related pages: ADME, PK and PBPK · Proteins, peptides and collagen · Microbiology · Bioavailability design
Health information notice
These statements have not been evaluated by the Food and Drug Administration. Nothing on this site is intended to diagnose, treat, cure or prevent any disease. The information is for general education only. It is not medical advice and does not replace advice, diagnosis or treatment from a qualified health professional, or any medication a clinician has prescribed.
Do not start, stop or change any medicine, supplement or herbal product because of something you read here. Talk to your doctor or pharmacist first, especially if you are pregnant or breastfeeding, have a medical condition, take any medicines, are preparing for surgery, or are caring for a child. Research findings, traditional uses and safety data are reported as their sources state them; they are not recommendations or claims about any product. If you think you may have a medical emergency, call your doctor or 911 at once.
EUTECNIQ Sciences sells no supplements or health products today and receives nothing from any product or ingredient mentioned on this site; any commercial interest it later has in an ingredient will be stated on that ingredient’s page.