

Proteins, peptides and collagen
A protein's nutritional value depends on how much of each indispensable amino acid it delivers after digestion, and U.S. labels correct the protein %DV for that quality. Collagen is an animal protein: no plant makes it, and the trial evidence for oral collagen peptides changes when funding and study quality are taken into account.
Berg JM, Tymoczko JL, Stryer L. Biochemistry, 5th ed. 2002, §3.1; FAO Food and Nutrition Paper 92 (2013), Table 5; eCFR Title 21, up to date as of Oct 26, 2026; Shoulders MD, Raines RT. Annu Rev Biochem. 2009;78:929–958.
Twenty amino acids
An α-amino acid is a central α carbon carrying an amino group, a carboxylic acid group, a hydrogen atom and a side chain (R group). The side chain sets size, charge and polarity. At neutral pH amino acids exist mainly as zwitterions, and only L amino acids are built into proteins.
| Amino acid | Codes | Formula | Molar mass, g/mol | Side-chain group | Indispensable (FAO 2013) |
|---|---|---|---|---|---|
| Glycine | Gly, G | C₂H₅NO₂ | 75.07 | Hydrophobic, aliphatic (achiral) | No |
| Alanine | Ala, A | C₃H₇NO₂ | 89.09 | Hydrophobic, aliphatic | No |
| Valine | Val, V | C₅H₁₁NO₂ | 117.15 | Hydrophobic, aliphatic | Yes |
| Leucine | Leu, L | C₆H₁₃NO₂ | 131.17 | Hydrophobic, aliphatic | Yes |
| Isoleucine | Ile, I | C₆H₁₃NO₂ | 131.17 | Hydrophobic, aliphatic | Yes |
| Methionine | Met, M | C₅H₁₁NO₂S | 149.21 | Hydrophobic, aliphatic (thioether) | Yes (scored with Cys) |
| Proline | Pro, P | C₅H₉NO₂ | 115.13 | Hydrophobic, aliphatic (ring closes on the amino N) | No |
| Phenylalanine | Phe, F | C₉H₁₁NO₂ | 165.19 | Aromatic | Yes (scored with Tyr) |
| Tyrosine | Tyr, Y | C₉H₁₁NO₃ | 181.19 | Aromatic, with hydroxyl | No |
| Tryptophan | Trp, W | C₁₁H₁₂N₂O₂ | 204.22 | Aromatic (indole) | Yes |
| Serine | Ser, S | C₃H₇NO₃ | 105.09 | Hydroxyl | No |
| Threonine | Thr, T | C₄H₉NO₃ | 119.12 | Hydroxyl | Yes |
| Cysteine | Cys, C | C₃H₇NO₂S | 121.16 | Thiol | No |
| Asparagine | Asn, N | C₄H₈N₂O₃ | 132.12 | Carboxamide | No |
| Glutamine | Gln, Q | C₅H₁₀N₂O₃ | 146.14 | Carboxamide | No |
| Aspartic acid | Asp, D | C₄H₇NO₄ | 133.10 | Acidic | No |
| Glutamic acid | Glu, E | C₅H₉NO₄ | 147.13 | Acidic | No |
| Lysine | Lys, K | C₆H₁₄N₂O₂ | 146.19 | Basic | Yes |
| Arginine | Arg, R | C₆H₁₄N₄O₂ | 174.20 | Basic | No |
| Histidine | His, H | C₆H₉N₃O₂ | 155.15 | Basic (imidazole) | Yes |
Formulas and molar masses: PubChem compound records (CIDs in the drawing below), retrieved Oct 27, 2026. Side-chain groups: Berg et al., Biochemistry, 5th ed., §3.1. Indispensable amino acids and the Met + Cys and Phe + Tyr pairs: FAO (2013) Food and Nutrition Paper 92, Table 5.
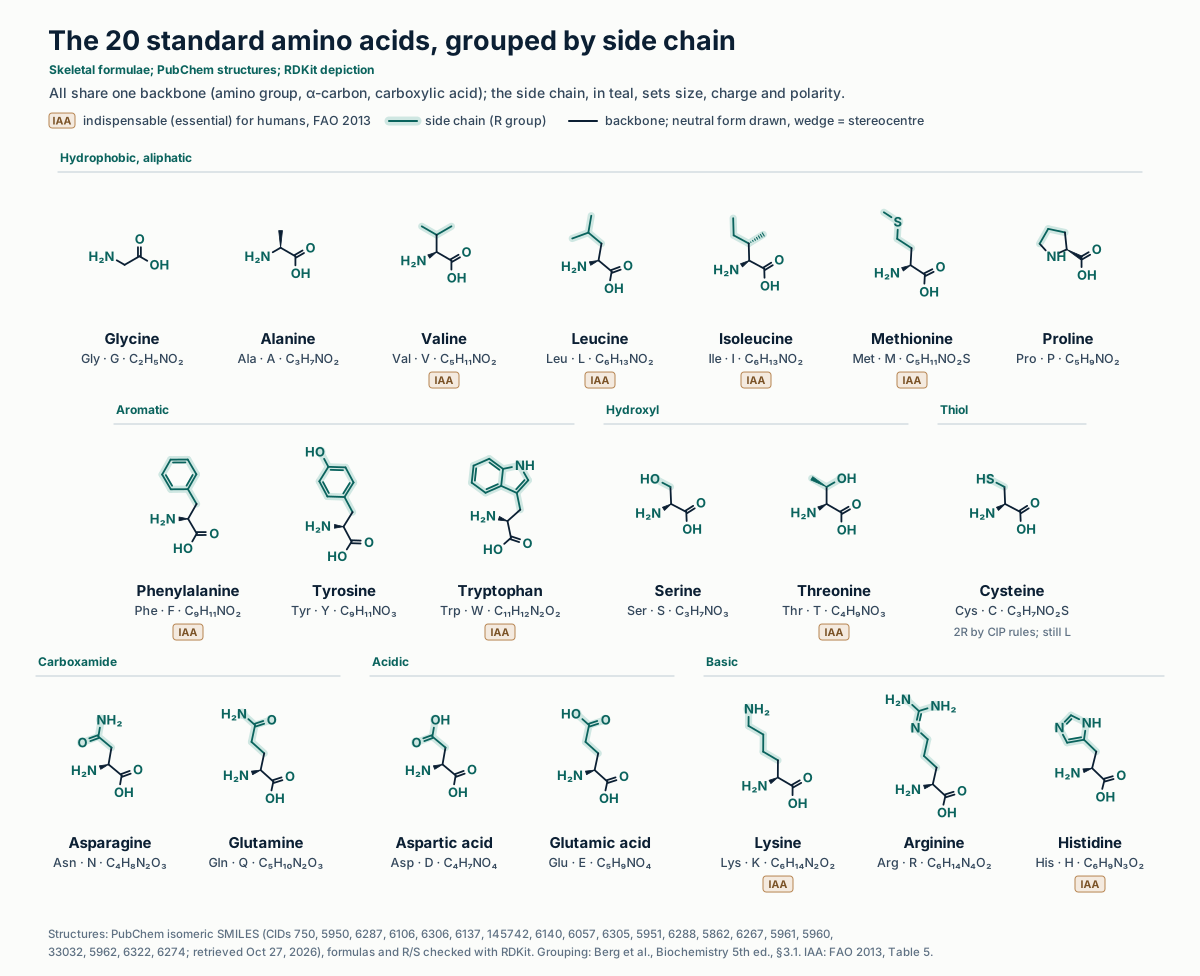
Nine indispensable amino acids
FAO scores protein against the amount of each indispensable amino acid a reference protein supplies per gram. Methionine is scored together with cysteine and phenylalanine with tyrosine. For regulatory use, FAO recommends human-milk composition for infant formula and the 6-month-to-3-year pattern for all other foods.
| Age group | His | Ile | Leu | Lys | Met + Cys | Phe + Tyr | Thr | Trp | Val |
|---|---|---|---|---|---|---|---|---|---|
| Infant, birth to 6 months (human milk) | 21 | 55 | 96 | 69 | 33 | 94 | 44 | 17 | 55 |
| Child, 6 months to 3 years | 20 | 32 | 66 | 57 | 27 | 52 | 31 | 8.5 | 43 |
| Older child, adolescent, adult | 16 | 30 | 61 | 48 | 23 | 41 | 25 | 6.6 | 40 |
Units: mg amino acid per g protein. FAO (2013) Dietary protein quality evaluation in human nutrition, Food and Nutrition Paper 92, Table 5 (patterns) and Section 2.1 (regulatory recommendation).
PDCAAS and DIAAS
Both scores divide a protein's amino acid content by a reference pattern and keep the lowest ratio. PDCAAS, recommended in 1989, corrects that ratio with one fecal crude-protein digestibility and is capped at 1.00. DIAAS, recommended by FAO in 2013, corrects each amino acid with its own true ileal digestibility.
| Feature | PDCAAS | DIAAS |
|---|---|---|
| Digestibility correction | One fecal crude-protein digestibility for all amino acids | True ileal digestibility of each amino acid, preferably in humans, else growing pigs, else growing rats |
| Values above 100% | Truncated | Not truncated for single ingredients; truncated for mixed diets and sole-source foods |
| Claim cut-offs | None in FAO's report | FAO examples: below 75 no claim; 75–99 "high" (good/source); 100 or more "excellent" |
| Known limits | Criticisms recorded by FAO: no credit for high-quality proteins; overestimates proteins with antinutritional factors, poorly digestible proteins supplemented with limiting amino acids, and proteins co-limited in more than one amino acid | FAO judged human ileal data insufficient in 2013 and allowed fecal crude-protein digestibility in the interim |
| U.S. food labels | Required basis of the corrected protein %DV (21 CFR 101.9(c)(7)(ii)) | Not referenced in 21 CFR 101.9 |
FAO (2013) Food and Nutrition Paper 92: §2.1 (key findings, interim fecal digestibility), §3.5 (criticisms of PDCAAS assessed by a 2001 working group), §4.1–4.2 (calculation, truncation, practical application), §4.8 (claims; cut-offs given as examples). eCFR, 21 CFR 101.9(c)(7)(ii), up to date as of Oct 26, 2026.
Scores of plant proteins
Herreman et al. computed DIAAS for 17 protein sources from published growing-pig digestibility data. With the 6-month-to-3-year pattern, potato protein averaged 100 and soy 91; pea, rice and the other plant proteins fell below 75. Lysine limits the cereals; methionine plus cysteine limits the legumes.
Two caveats apply. Most datasets describe feed-grade materials, and the authors call for data on food-grade proteins. All four authors were employees of Avebe, a potato-protein producer.
Limiting amino acids and blends
Measured compositions agree with the scores: lysine is low in wheat, corn, oat and brown rice protein, and methionine is low in pea, soy, lupin and oat protein. Blending a lysine-poor cereal with a methionine-poor legume raises the lowest ratio, which is why blends can score higher than either source.
| Protein isolate | Essential amino acids, % of protein | Lysine, % of protein | Methionine, % of protein |
|---|---|---|---|
| Oat | 21 | 2.1 | 0.2 |
| Lupin | 21 | 3.5 | 0.3 |
| Wheat | 22 | 1.4 | 0.9 |
| Hemp | 23 | 2.8 | 2.0 |
| Microalgae | 23 | 5.3 | 0.0 |
| Soy | 27 | 4.6 | 0.4 |
| Brown rice | 28 | 2.4 | 2.5 |
| Pea | 30 | 5.9 | 0.4 |
| Corn | 32 | 1.5 | 1.7 |
| Potato | 37 | 6.0 | 1.6 |
| Whey (for comparison) | 43 | — | — |
Gorissen SHM, et al. Amino Acids. 2018;50(12):1685–1695 (open access), Results text: 35 commercial powders analyzed by UPLC-MS/MS in one laboratory; protein = N × 6.25; tryptophan not measured, so "essential" here sums eight amino acids. Lysine and methionine values for whey are in the paper's figures only and are not restated. Funding: Top Institute Food and Nutrition (public–private partnership).
| Blend | Ratio, % of protein | Maximum DIAAS (capped at 100) |
|---|---|---|
| Pea / rice | 59 / 41 | 84 |
| Pea / wheat | 60 / 40 | 85 |
| Canola / pea | 35 / 65 | 84 |
| Fava bean / corn | 75 / 25 | 64 |
| Corn / soy | 15 / 85 | 88 |
| Soy / wheat | 90 / 10 | 90 |
| Pea / wheat / potato | 25 / 25 / 50 | 100 |
| Wheat / potato | 30 / 70 | 100 |
Herreman et al. 2020, Table 3 and Figure 3 (0.5–3 y pattern; simulated from mean amino acid content and mean SID, equal protein content assumed).
Bioactive peptides from plants
Proteases cut proteins into peptides, and some peptides inhibit enzymes in a test tube. That is a first step only. An ACE-inhibiting peptide must survive digestion and cross the gut wall to act after a meal, and in vitro inhibition does not always predict an effect in vivo.
Lunasin, a 43-residue soybean peptide, is the plant peptide with human data in the table; the human data are small and the one trial found no effect.
| Peptide and source | What was measured | Result | Human evidence in the source |
|---|---|---|---|
| Lunasin; soybean 2S albumin small subunit | Gene expressed in mouse and human cell lines | Bound chromatin and arrested cell division in transfected cells | None (cell culture) |
| Lunasin; 50 g/day soy protein for 5 days | Plasma lunasin by ELISA, 5 men aged 18–25 | 66.0 ± 25.4 ng/mL at 30 min; estimated absorption 4.5% (range 2.2–7.8%) | Absorption only; no outcome measured |
| Lunasin-enriched soy extract, 335 mg/day for 8 weeks | Triple-blind placebo-controlled crossover, 31 adults | No significant change in serum lipids, glucose, insulin, blood pressure, BMI or waist | One small trial; null result |
| Val-Leu-Ile-Val-Pro; soybean glycinin hydrolysate | ACE inhibition, enzyme assay | IC50 1.69 ± 0.17 µM; resisted gastrointestinal proteases in vitro | None reported |
| Ile-Phe-Leu and Trp-Leu; tofuyo (fermented soybean food) | ACE inhibition, enzyme assay | IC50 44.8 µM and 29.9 µM; Trp-Leu kept 29% of its activity after pepsin, chymotrypsin and trypsin in sequence | None reported |
Galvez AF, de Lumen BO. Nat Biotechnol. 1999;17(5):495–500. Dia VP, et al. J Agric Food Chem. 2009;57(4):1260–1266. Haddad Tabrizi S, et al. J Diet Suppl. 2020;17(3):286–299. Mallikarjun Gouda KG, et al. J Agric Food Chem. 2006;54(13):4568–4573. Kuba M, et al. Biosci Biotechnol Biochem. 2003;67(6):1278–1283. In vitro to in vivo gap: Vermeirssen V, et al. Br J Nutr. 2004;92(3):357–366. A 2022 review (Yuan H, et al. Food Funct. 2022;13:3133–3158) calls for more preclinical and clinical trials before health claims for plant peptides.
How collagen is built
Collagen is three polypeptide strands, each a left-handed polyproline II-type helix, wound into a right-handed triple helix with a one-residue stagger. The tight packing requires glycine at every third position, giving the Gly-Xaa-Yaa repeat. Prolyl 4-hydroxylase converts proline in the Yaa position to 4-hydroxyproline before folding, which raises the helix's thermal stability.
| Quantity | Value |
|---|---|
| Collagen types in vertebrates | 28, from at least 46 distinct polypeptide chains |
| Share of total protein in humans | About one-third; about three-quarters of skin dry weight |
| Xaa position, most often | Proline, 28% |
| Yaa position, most often | (2S,4R)-4-hydroxyproline, 38% |
| Most common triplet | Pro-Hyp-Gly, 10.5% |
| Type I triple helix | About 300 nm long, under 2 nm in diameter |
| Type I fibril D-period | 67 nm |
| Gelatin DIAAS, 0.5–3 y pattern | 2 (tryptophan limiting) |
Shoulders MD, Raines RT. Collagen structure and stability. Annu Rev Biochem. 2009;78:929–958 (PMC2846778), introduction and fibril sections. Gelatin DIAAS: Herreman et al. 2020, Table 2.
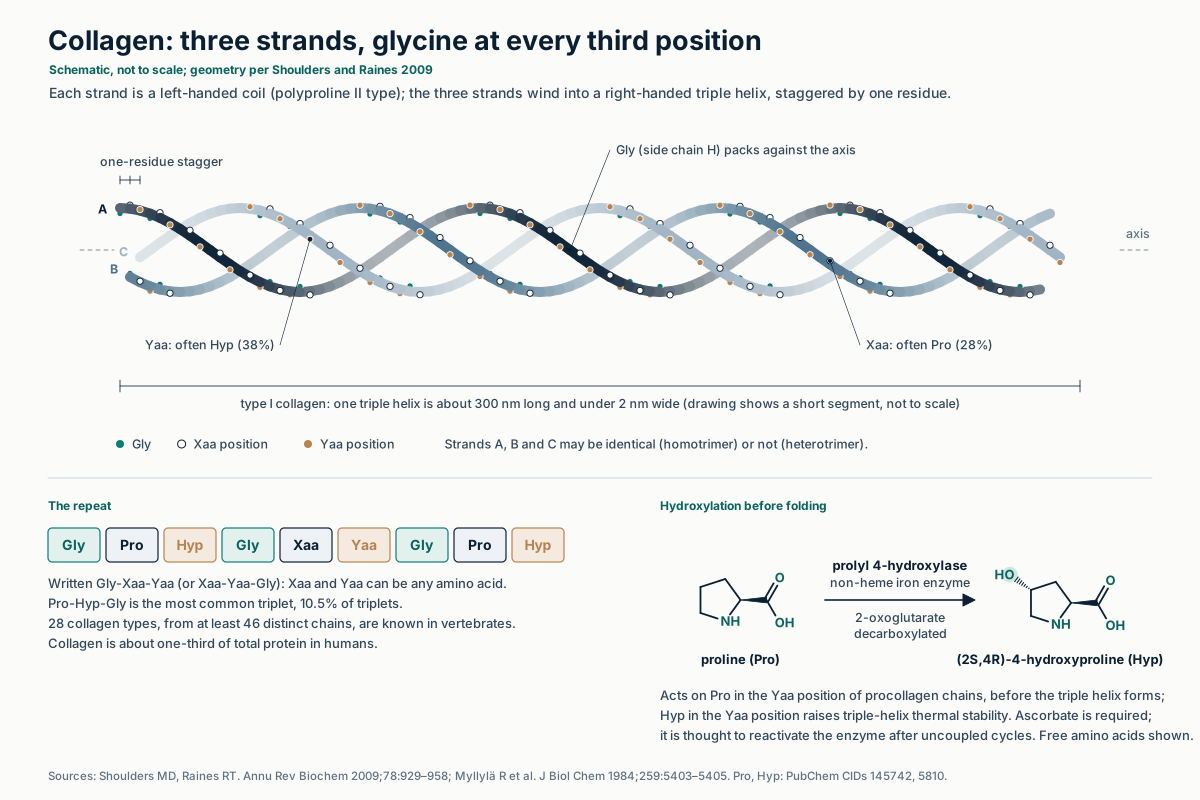
No plant makes collagen
Collagen is a specific component of animal extracellular matrices, found from sponges to humans; plants build their structural matrix from other molecules, among them proline- or glycine-rich structural proteins such as extensin. A product sold as "plant collagen" or a plant-based collagen booster therefore contains no collagen. What it can contain are cofactors and substrates of collagen synthesis.
| Ingredient | Biochemical link to collagen | Not shown by these sources |
|---|---|---|
| Vitamin C (ascorbate) | "Virtually a specific requirement" of prolyl 4-hydroxylase and lysyl hydroxylase; it is consumed in uncoupled reaction cycles and is thought to reactivate the enzymes after them. Deficiency is associated with defective connective tissue. | That extra vitamin C raises collagen in people with adequate intake |
| Glycine | Every third residue of the triple helix | That oral glycine increases collagen synthesis |
| Proline | Most frequent Xaa residue (28%); the precursor of hydroxyproline | That oral proline increases collagen synthesis |
| "Plant collagen" | None: no plant synthesizes collagen | — |
Exposito JY, et al. Evolution of collagens. Anat Rec. 2002;268(3):302–316; Exposito JY, et al. Int J Mol Sci. 2010;11(2):407–426. Plant Pro/Gly-rich structural proteins: Shoulders and Raines 2009. Ascorbate: Myllylä R, et al. J Biol Chem. 1984;259(9):5403–5405; Peterkofsky B. Am J Clin Nutr. 1991;54(6 Suppl):1135S–1140S.
Recombinant collagen and gelatin
Yeast and tobacco can make human-sequence collagen only when given the human genes, and a stable triple helix also needs a prolyl 4-hydroxylase. Without hydroxylation the product is a non-hydroxylated gelatin. Tobacco carrying human collagen genes is a production host, not a plant source of collagen.
| Host and product | Genes introduced | Reported result | Source |
|---|---|---|---|
| Yeast Pichia pastoris, human type III procollagen | Collagen chain plus the human P4H α subunit and protein disulfide isomerase | Stable triple helices formed only with the hydroxylase; enzyme assembly rose 10-fold with collagen co-expressed | Vuorela et al., EMBO J 1997 |
| P. pastoris, gelatins from mouse type I and rat type III sequences | Collagen-based sequences only | Non-hydroxylated gelatins secreted at up to 14.8 g/L clarified broth | Werten et al., Yeast 1999 |
| Tobacco, human homotrimeric collagen I | Human proα1(I) chain | Stable homotrimeric triple helix, processed to collagen; purified from field-grown plants | Ruggiero et al., FEBS Lett 2000 |
| Tobacco, hydroxylated collagen I | Human collagen I plus a chimeric P4H | Thermal stability raised to 37 °C | Merle et al., FEBS Lett 2002 |
| Tobacco, human heterotrimeric collagen I | Two human collagen genes plus human P4H and lysyl hydroxylase 3 | Procollagen about 2% of extracted total soluble protein; thermally stable triple helix | Stein et al., Biomacromolecules 2009 (authors from CollPlant Ltd.) |
Vuorela A, et al. EMBO J. 1997;16(22):6702–6712. Werten MW, et al. Yeast. 1999;15(11):1087–1096. Ruggiero F, et al. FEBS Lett. 2000;469(1):132–136. Merle C, et al. FEBS Lett. 2002;515(1–3):114–118. Stein H, et al. Biomacromolecules. 2009;10(9):2640–2645. The regulatory status of these materials as food or supplement ingredients is not covered by these sources.
Oral collagen peptides in trials
Some collagen peptides reach the blood intact: after 9.4–23 g of gelatin hydrolysate, peptide-bound hydroxyproline peaked at 20–60 nmol/mL plasma within 1–2 h, mostly as Pro-Hyp. Pooled skin trials favor collagen overall, but a 2025 meta-analysis found no effect in trials without pharmaceutical-company funding or in high-quality trials.
| Meta-analysis | Trials, participants | Pooled result | Heterogeneity and bias | Funding and quality subgroups |
|---|---|---|---|---|
| de Miranda et al., Int J Dermatol 2021 | 19 RCTs, 1,125 (aged 20–70, 95% women) | Favors hydrolyzed collagen for hydration, elasticity and wrinkles | Not reported in the abstract | Not reported in the abstract |
| Danessa et al., Indian J Dermatol Venereol Leprol 2025 | 10 RCTs, 646 (published 2010–2021) | Hydration SMD 1.25 (95% CI 0.77–1.74); elasticity SMD 0.61 (0.21–1.02) | I² 55.5–56.5%; risk of bias generally unclear; publication bias not assessable | Not analyzed |
| Myung and Park, Am J Med 2025 | 23 RCTs, 1,474 (search to June 14, 2024) | All trials: significant improvement in hydration, elasticity and wrinkles | High-quality trials: no significant effect in any outcome; low-quality trials: improved elasticity | No effect in trials without pharmaceutical-company funding; significant effects in funded trials |
Absorption: Iwai K, et al. J Agric Food Chem. 2005;53(16):6531–6536; source dependence: Ohara H, et al. J Agric Food Chem. 2007;55(4):1532–1535 (5 men). Meta-analyses (PubMed abstracts): de Miranda RB, et al. Int J Dermatol. 2021;60(12):1449–1461; Danessa G, et al. Indian J Dermatol Venereol Leprol. 2025;91(6):730–740; Myung SK, Park Y. Am J Med. 2025;138(9):1264–1277. Outcomes other than skin are not covered here.
Protein on U.S. labels
The grams of protein on a label measure quantity; the %DV, when shown, measures quality-corrected protein. The %DV must appear whenever a protein claim is made, and it is computed from protein × PDCAAS, capped at 1.00. Amino acids are dietary ingredients under the statute, but a supplement made only of individual amino acids declares no protein.
| Rule | Requirement | Citation |
|---|---|---|
| Protein content | Grams per serving to the nearest gram; usually N × 6.25 by AOAC methods | 21 CFR 101.9(c)(7) |
| Low-quality protein | PDCAAS below 20% (adults and children 4+) or below 40% (ages 1–3): state "not a significant source of protein" or list the corrected %DV | 21 CFR 101.9(c)(7) |
| When %DV is mandatory | When a protein claim is made, or the food is for infants through 12 months or children 1–3 years | 21 CFR 101.9(c)(7)(i) |
| Corrected protein | Protein (g) × PDCAAS, with the score capped at 1.00; PDCAAS by the methods of the Joint FAO/WHO Expert Consultation report on protein quality | 21 CFR 101.9(c)(7)(ii) |
| Reference values | DRV 50 g (adults, children 4+); DRV 13 g (ages 1–3); RDI 11 g (infants); RDI 71 g (pregnancy and lactation) | 21 CFR 101.9(c)(7)(iii) |
| Claim levels | "Good source": 10–19% of the DRV per reference amount; "high": 20% or more | 21 CFR 101.54(b), (c) |
| Supplement Facts | Protein %DV uses the corrected amount; protein is not declared on products that contain only individual amino acids | 21 CFR 101.36(b)(2)(i), (iii) |
| Dietary ingredient | "An amino acid" is one of the listed dietary ingredients | 21 U.S.C. 321(ff)(1)(D) |
| Protein per serving, g | PDCAAS (illustrative) | Corrected protein, g | %DV (DRV 50 g) | Note |
|---|---|---|---|---|
| 10 | 1.00 | 10.0 | 20% | A score above 1.00 would also be set to 1.00 |
| 10 | 0.80 | 8.0 | 16% | Same grams, lower %DV |
| 10 | 0.50 | 5.0 | 10% | Half the %DV of the first row |
| 10 | 0.15 | 1.5 | 3% | Below 20%: the label must say "not a significant source of protein" or show this %DV |
eCFR Title 21, §§ 101.9(c)(7), 101.36(b)(2), 101.54(b)–(c), up to date as of Oct 26, 2026; 21 U.S.C. 321(ff)(1) (Cornell LII). Worked example: arithmetic of § 101.9(c)(7)(ii) with illustrative PDCAAS values, not measured scores of any product.
Where EUTECNIQ would work
EUTECNIQ is in formation and has no laboratory yet. Once equipped, it would measure the protein and amino acid content of botanical protein ingredients, calculate PDCAAS and DIAAS from documented digestibility data, and check protein declarations against 21 CFR 101.9(c)(7). It would not describe any plant ingredient as collagen.
Related: Bioactive compounds · Dietary supplements · Foods and beverages · CFR atlas
Health information notice
These statements have not been evaluated by the Food and Drug Administration. Nothing on this site is intended to diagnose, treat, cure or prevent any disease. The information is for general education only. It is not medical advice and does not replace advice, diagnosis or treatment from a qualified health professional, or any medication a clinician has prescribed.
Do not start, stop or change any medicine, supplement or herbal product because of something you read here. Talk to your doctor or pharmacist first, especially if you are pregnant or breastfeeding, have a medical condition, take any medicines, are preparing for surgery, or are caring for a child. Research findings, traditional uses and safety data are reported as their sources state them; they are not recommendations or claims about any product. If you think you may have a medical emergency, call your doctor or 911 at once.
EUTECNIQ Sciences sells no supplements or health products today and receives nothing from any product or ingredient mentioned on this site; any commercial interest it later has in an ingredient will be stated on that ingredient’s page.