

Analytical instruments
Each instrument turns one physical property, such as retention, mass, absorbed light or nuclear spin, into a signal, and each has a known selectivity and a known blind spot. This page explains how the instruments used on botanicals work, what they can and cannot establish, and what U.S. rules and international guidelines require for identity testing and validation.
McGlynn DF, et al. J Am Soc Mass Spectrom. 2025;36(2):389–399; De Vos J, et al. Anal Sci Adv. 2021;2(3–4):171–192; USP ⟨761⟩ (USP 38–NF 33 text); Ragupathy S, et al. Heliyon. 2019;5(6):e01935.
Status. EUTECNIQ is in formation and owns no instrument and no validated method. Nothing on this page reports a EUTECNIQ result; drawings are generic and imply no instrument brand or model.
Related: Analytical and characterization technologies · Method development and validation · Targeted and non-targeted analysis · Academy: plant identity

Liquid chromatography and UV detection
A pump drives the mobile phase through a column of porous particles, and compounds separate because each spends a different fraction of its time in the stationary phase. Peak broadening is expressed as plate height H. Smaller particles lower H, but column pressure rises with 1/dp², which is why sub-2 µm columns need UHPLC pumps.
A diode-array detector (DAD) sends all wavelengths through the flow cell and then disperses them onto a photodiode array, so every data point carries a UV-visible spectrum.
| Particle diameter dp, µm | Minimum H, µm | Optimum velocity, mm/s | Plates in a 100 mm column at the optimum | Pressure at the optimum, relative to 5 µm |
|---|---|---|---|---|
| 5 | 9.7 | 0.86 | 10,300 | 1.0 |
| 3 | 5.8 | 1.43 | 17,200 | 4.6 |
| 1.7 | 3.3 | 2.52 | 30,300 | 25.4 |
Computed with the Knox equation above (minimum reduced plate height 1.94 at ν = 4.29, close to the h ≈ 2 that Broeckhoven K, Cabooter D, Desmet G. J Pharm Anal. 2013;3(5):313–323 describe as the norm for well-packed fully porous columns). Pressure scales with u/dp² at fixed length and viscosity (Broeckhoven et al. 2013, Eq. 3), so (5/1.7)³ = 25.4 at each column's own optimum.
| Item | Published value or rule | Source |
|---|---|---|
| HPLC pressure standard | 400 bar, for over 30 years before UHPLC | De Vos et al. 2021 |
| First commercial UHPLC | 2004, upper pressure limit 1,000 bar; current commercial limits up to 1,500 bar | De Vos et al. 2021 |
| UHPLC column format | 2.1 mm i.d. with sub-2 µm particles, adopted to limit frictional (viscous) heating at ultra-high pressure | De Vos et al. 2021 |
| Core–shell particles | 2.6–2.7 µm core–shell particles perform like sub-2 µm fully porous ones at 2–2.5 times lower pressure; minimum h of 1.5–1.8 against about 2 | Broeckhoven et al. 2013 |
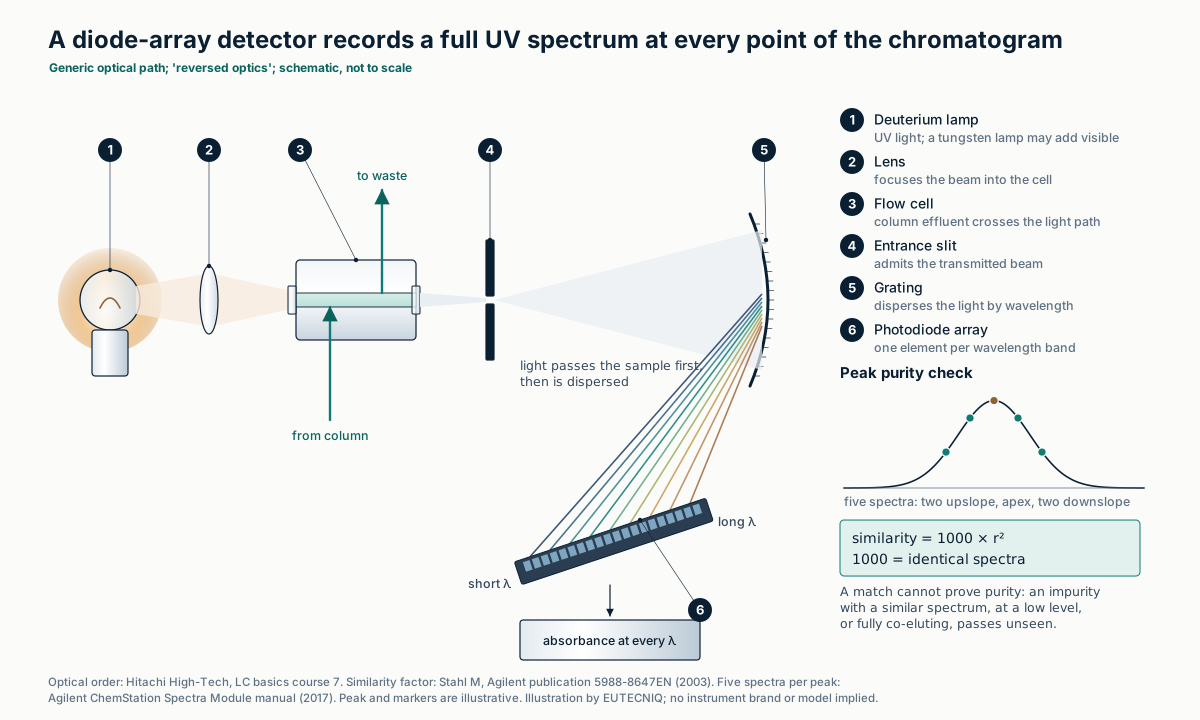
| DAD spectral similarity | Similarity = 1000 × r², where r correlates the absorbances of two spectra; 1000 means identical spectra | Stahl 2003 |
| DAD purity check | Five spectra per peak (two on the upslope, the apex, two on the downslope) compared with all spectra across the peak; default threshold 990 | Agilent ChemStation Spectra Module manual, 2017 |
| What purity checks cannot do | "Can only confirm the presence of impurities and never prove absolutely that the peak is pure"; an impurity with a similar spectrum, at very low level or fully co-eluting passes unseen | Stahl 2003 |
De Vos J, Stoll D, Buckenmaier S, Eeltink S, Grinias JP. Anal Sci Adv. 2021;2(3–4):171–192. Broeckhoven et al. 2013. Stahl M. Peak purity analysis in HPLC and CE using diode-array technology. Agilent Technologies, publication 5988-8647EN; 2003. Agilent. Understanding Your ChemStation Spectra Module, edition 04/17. DAD optical path: Hitachi High-Tech, LC basics, course 7. The generic HPLC flow path is drawn on the analytical technologies page.
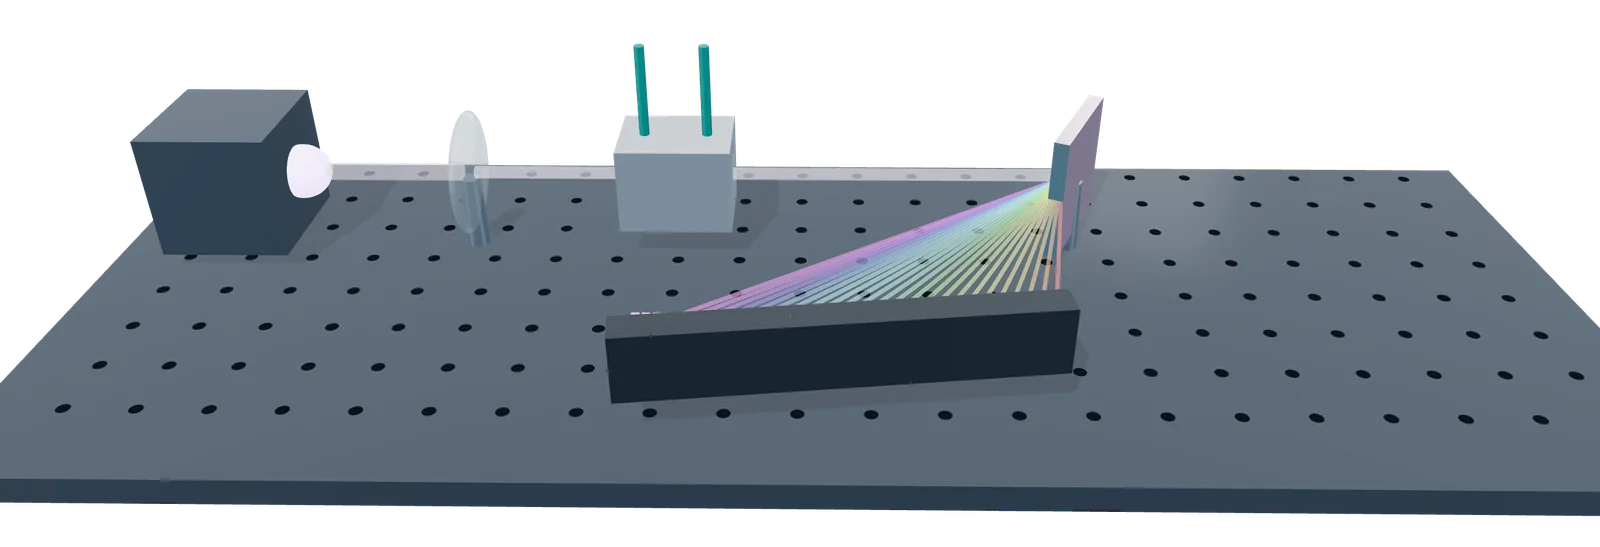
- 1 Deuterium lamp
- 2 Lens
- 3 Flow cell: eluent from the column
- 4 Grating spreads the light by wavelength
- 5 Photodiode array: one diode per wavelength band
Rendered by EUTECNIQ; schematic, a generic instrument. EUTECNIQ has no equipment yet.
Triple-quadrupole LC-MS/MS
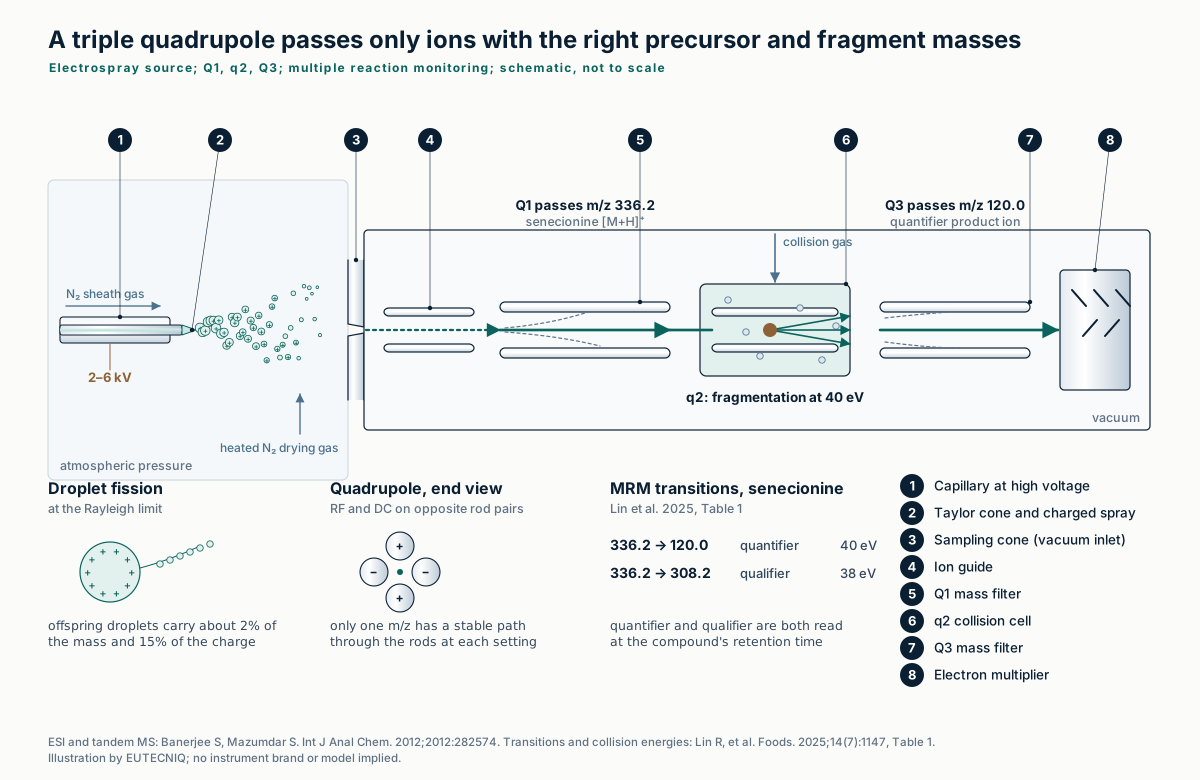
Electrospray ionization (ESI) moves analyte ions from the column effluent into the gas phase with little fragmentation. A potential of 2–6 kV draws the liquid into a Taylor cone; the charged droplets shrink by evaporation and split when charge repulsion overcomes surface tension at the Rayleigh limit.
In a triple quadrupole, Q1 selects a precursor m/z, q2 fragments it by collision with a gas, and Q3 passes one product ion. Monitoring several such pairs is multiple reaction monitoring (MRM).
| Compound | Retention time, min | Precursor [M+H]⁺, m/z | Product ions, m/z (quantifier / qualifier) | Collision energy, eV |
|---|---|---|---|---|
| Intermedine | 4.64 | 300.2 | 94.2 / 138.3 | 33 / 30 |
| Lycopsamine | 4.78 | 300.2 | 94.2 / 156.4 | 34 / 38 |
| Seneciphylline | 5.77 | 334.2 | 120.2 / 306.1 | 37 / 36 |
| Senecionine | 6.40 | 336.2 | 120.0 / 308.2 | 40 / 38 |
| Echimidine | 6.96 | 398.2 | 120.0 / 220.1 | 32 / 26 |
| Lasiocarpine | 7.79 | 412.2 | 120.0 / 336.2 | 36 / 27 |
Lin R, et al. Quantitative analysis of pyrrolizidine alkaloids in food matrices and plant-derived samples using UHPLC-MS/MS. Foods. 2025;14(7):1147, Table 1 (positive ESI, ion spray voltage 5,500 V). Intermedine and lycopsamine are isomers with the same precursor and quantifier ion; only their 0.14 min retention difference and their qualifier ions tell them apart. In tea, the method's detection limits were 0.03–0.75 µg/kg. ESI mechanism: Banerjee S, Mazumdar S. Int J Anal Chem. 2012;2012:282574.

- 1 Ion source
- 2 Q1 selects the precursor ion
- 3 q2 collision cell fragments it
- 4 Q3 selects one product ion
- 5 Detector
Rendered by EUTECNIQ; schematic, a generic instrument. EUTECNIQ has no equipment yet.
Q-TOF and Orbitrap
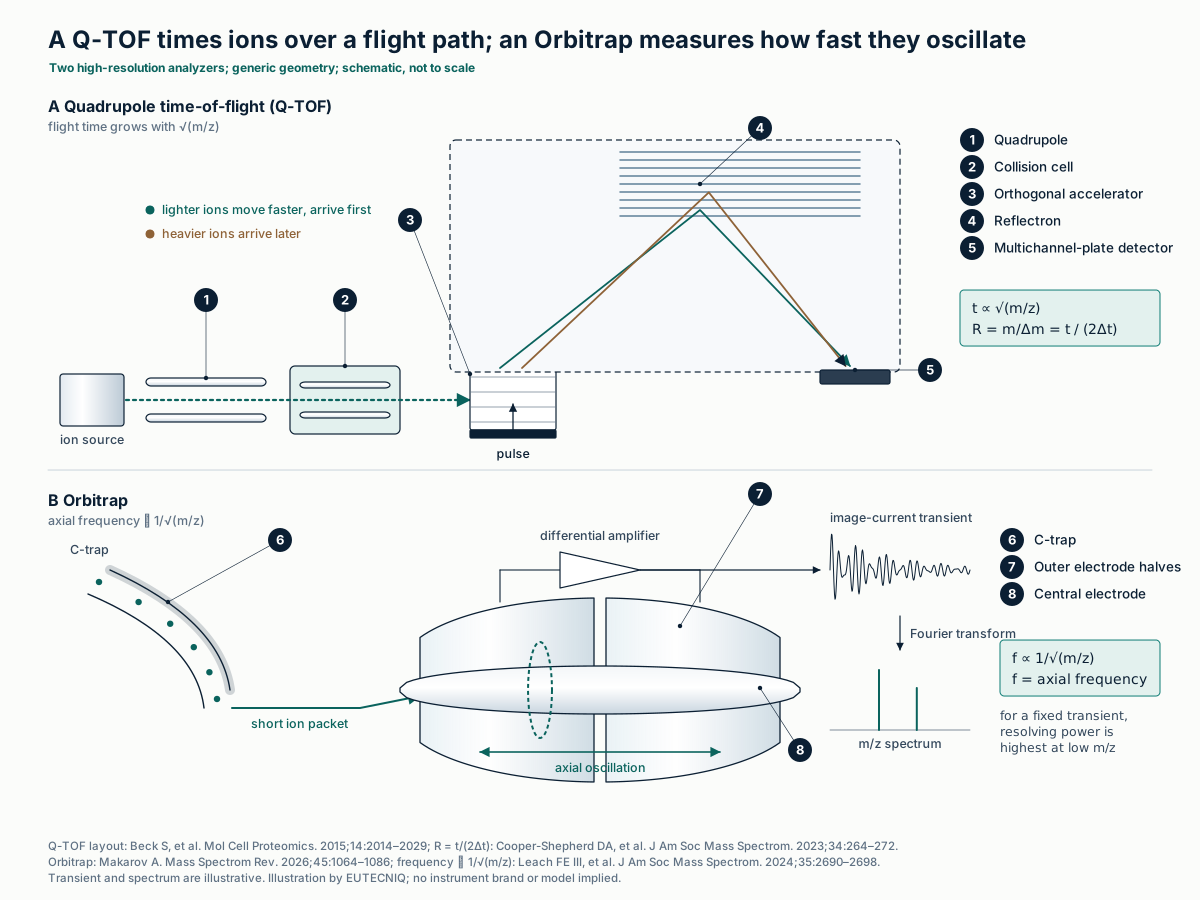
Mass accuracy is the error of a measured m/z, in parts per million; resolving power is m/Δm, with Δm the peak width at half height (FWHM). A Q-TOF pushes ion packets into a flight tube, where flight time grows with √(m/z). An Orbitrap traps ions around a spindle electrode; their axial frequency is proportional to (m/z)−½ and is read by Fourier transform of the image current.
Accurate mass narrows the candidate formulas but does not identify a compound: even below 1 ppm, many formulas remain at higher mass (targeted and non-targeted analysis).
| Item | Value | Source |
|---|---|---|
| Q-TOF resolving power (review) | Typically 10,000–60,000 FWHM; mass accuracy at the ppm level | Li et al. 2026 |
| A benchtop Q-TOF (2015) | 40,000 at m/z 1222; average absolute mass deviation better than 1.45 ppm in proteomics data | Beck et al. 2015 |
| Multireflecting TOF (2023) | Over 200,000 FWHM with a 48 m effective path; sub-ppm accuracy | Cooper-Shepherd et al. 2023 |
| Orbitrap (review) | Over 100,000 FWHM, up to 1,000,000; sub-ppm accuracy | Li et al. 2026 |
| Orbitrap, older generation | Maximum 100,000 at m/z 400 with a 1.5 s transient; resolving power is highest at low m/z | Leach et al. 2024 |
| Orbitrap, current limits | Mass resolutions above 2 million reported | Makarov 2026 |
| Quercetin vs hesperetin [M+H]⁺ | Δm 0.0364 u at m/z 303.05, so m/Δm ≈ 8,300 (peak width equal to the separation) | Computed here |
| ¹³C₂ vs H₂ mass split | 8.9 mDa at m/z 600–950: at least 50,000 to begin to resolve a 1:1 doublet | Leach et al. 2024 |
Kind T, Fiehn O. BMC Bioinformatics. 2006;7:234 (FWHM definition of resolving power; formula candidates). Cooper-Shepherd DA, et al. J Am Soc Mass Spectrom. 2023;34(2):264–272 (R = t/2Δt; reflectron geometry). Beck S, et al. Mol Cell Proteomics. 2015;14(7):2014–2029. Li R, et al. J Anal Methods Chem. 2026:7886371. Leach FE III, Nagornov KO, Kozhinov AN, Tsybin YO. J Am Soc Mass Spectrom. 2024;35(11):2690–2698. Makarov A. Mass Spectrom Rev. 2026;45(6):1064–1086. Instrument figures are published examples, not specifications of any product.
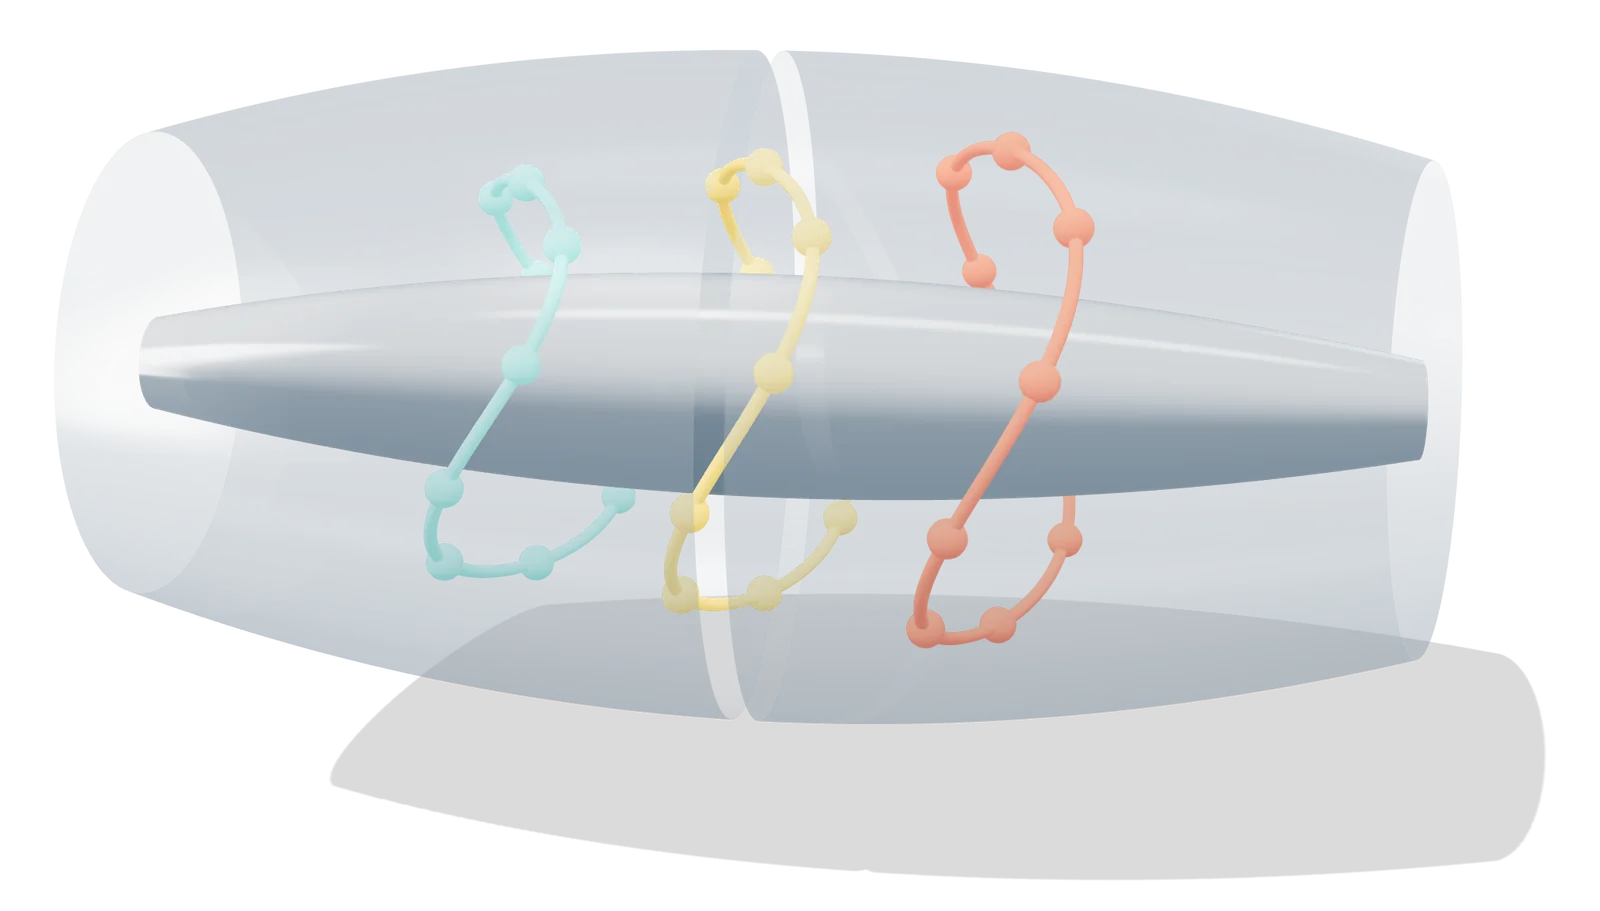
- 1 Central spindle electrode
- 2 Outer electrode, split in two
- 3 Ions orbit and oscillate along the axis
Rendered by EUTECNIQ; schematic, a generic instrument. EUTECNIQ has no equipment yet.
GC-MS, GC-FID and headspace
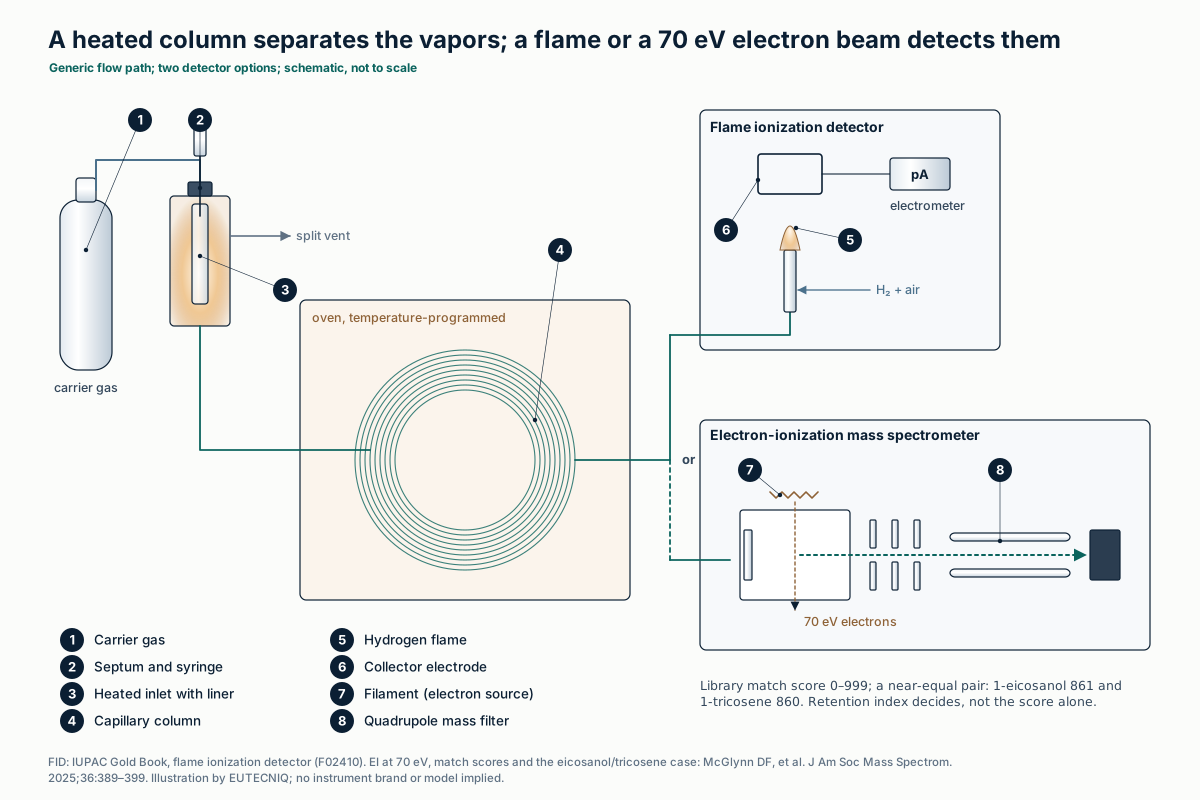
In GC-MS, compounds leaving the column are ionized by electrons, generally at 70 eV, giving reproducible fragment patterns that are matched against reference libraries. A match factor ranks candidates; retention indices confirm them, because different compounds can give near-identical spectra.
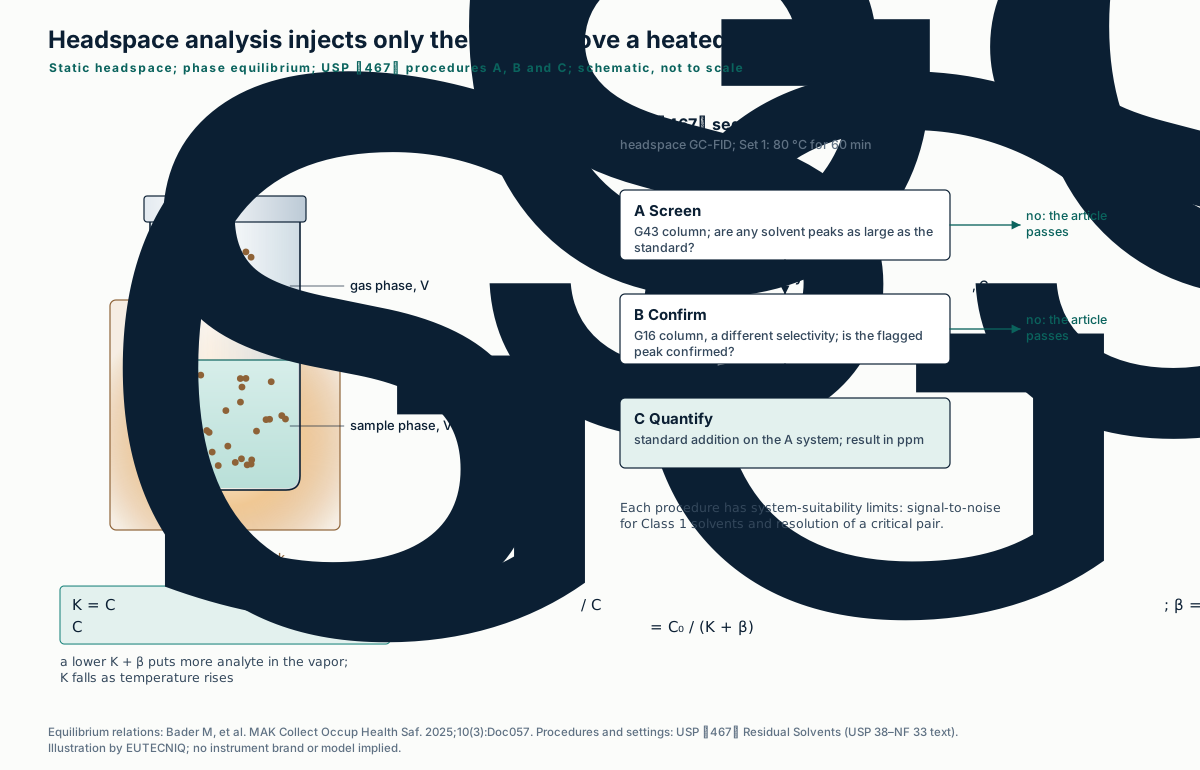
A flame-ionization detector (FID) burns the effluent in hydrogen and measures the ion current, which follows the mass flow of the eluting compound. Static headspace injects only the vapor above a heated, sealed sample, so non-volatile matrix stays in the vial.
| Item | Published value or finding | Source |
|---|---|---|
| NIST 2026 EI main library | 382,180 compounds; 188,198 with retention-index data; replicate library of 49,095 spectra | NIST SRD 1A |
| Match score scale | 0 to 999, commonly a modified cosine similarity; NIST search software can penalize retention-index differences beyond a set threshold | McGlynn et al. 2025 |
| Two near-equal hits | 1-Eicosanol (score 861, RI 2282) and 1-tricosene (score 860, RI 2291) for one query spectrum at RI 2294; the alcohol's derivatized form was found 60 RI units later, so 1-eicosanol "would almost certainly be incorrect" | McGlynn et al. 2025 |
| FID response | Current proportional to the instantaneous flow rate of the eluted component; relatively insensitive to inorganic molecules; linear range 10³–10⁵ | IUPAC Gold Book F02410 |
| Headspace sensitivity | Rises as K + β falls; K generally falls as temperature rises; more sample volume helps only when K is much smaller than β | Bader et al. 2025 |
NIST Standard Reference Database 1A, Mass Spectral Libraries 2026 edition (product page, read October 28, 2026). McGlynn DF, et al. J Am Soc Mass Spectrom. 2025;36(2):389–399. IUPAC Compendium of Chemical Terminology, "flame ionization detector" (Pure Appl Chem 1990;62:2167). Bader M, et al. MAK Collect Occup Health Saf. 2025;10(3):Doc057.
| USP ⟨467⟩ procedure | Purpose | Column (0.32 mm × 30 m option) | Oven program | System suitability |
|---|---|---|---|---|
| A | Screening: does any solvent peak approach its limit? | G43 phase, 1.8 µm film | 40 °C for 20 min, 10 °C/min to 240 °C, hold 20 min | S/N ≥ 5 for 1,1,1-trichloroethane; ≥ 3 for each Class 1 peak; resolution ≥ 1.0 acetonitrile / methylene chloride |
| B | Confirmation of flagged peaks on a second phase | G16 phase, 0.25 µm film | 50 °C for 20 min, 6 °C/min to 165 °C, hold 20 min | S/N ≥ 5 for benzene; resolution ≥ 1.0 acetonitrile / cis-dichloroethene |
| C | Quantitation by standard addition | Procedure A system (or B if A performs worse) | As A | As A; ppm = 5(C/W)[rU/(rST − rU)] |
USP ⟨467⟩ Residual Solvents, water-soluble articles (USP 38–NF 33 text): FID, injector 140 °C, detector 250 °C, split 1:5, carrier about 35 cm/s; headspace Set 1 equilibrates 60 min at 80 °C. Solvent classes and limits: ICH Q3C(R9), summarized on the CFR atlas.
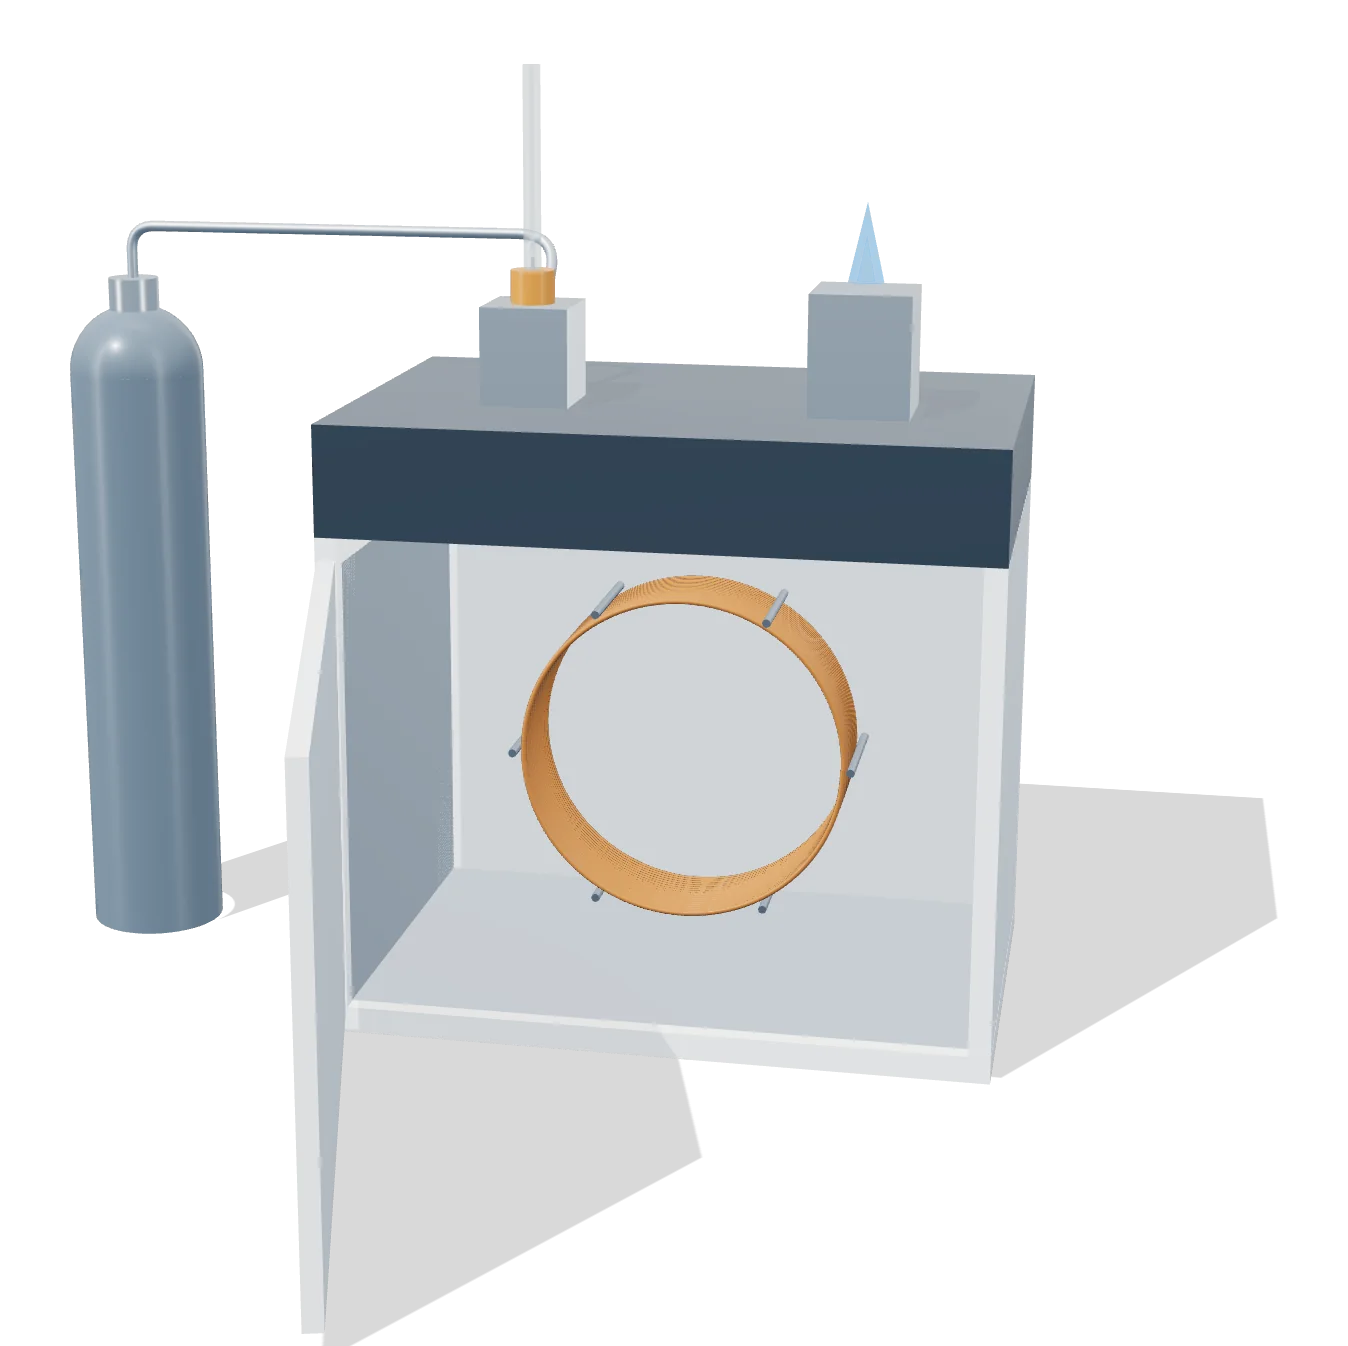
- 1 Carrier gas
- 2 Heated injector
- 3 Capillary column, coiled in the oven
- 4 Flame ionization detector
Rendered by EUTECNIQ; schematic, a generic instrument. EUTECNIQ has no equipment yet.
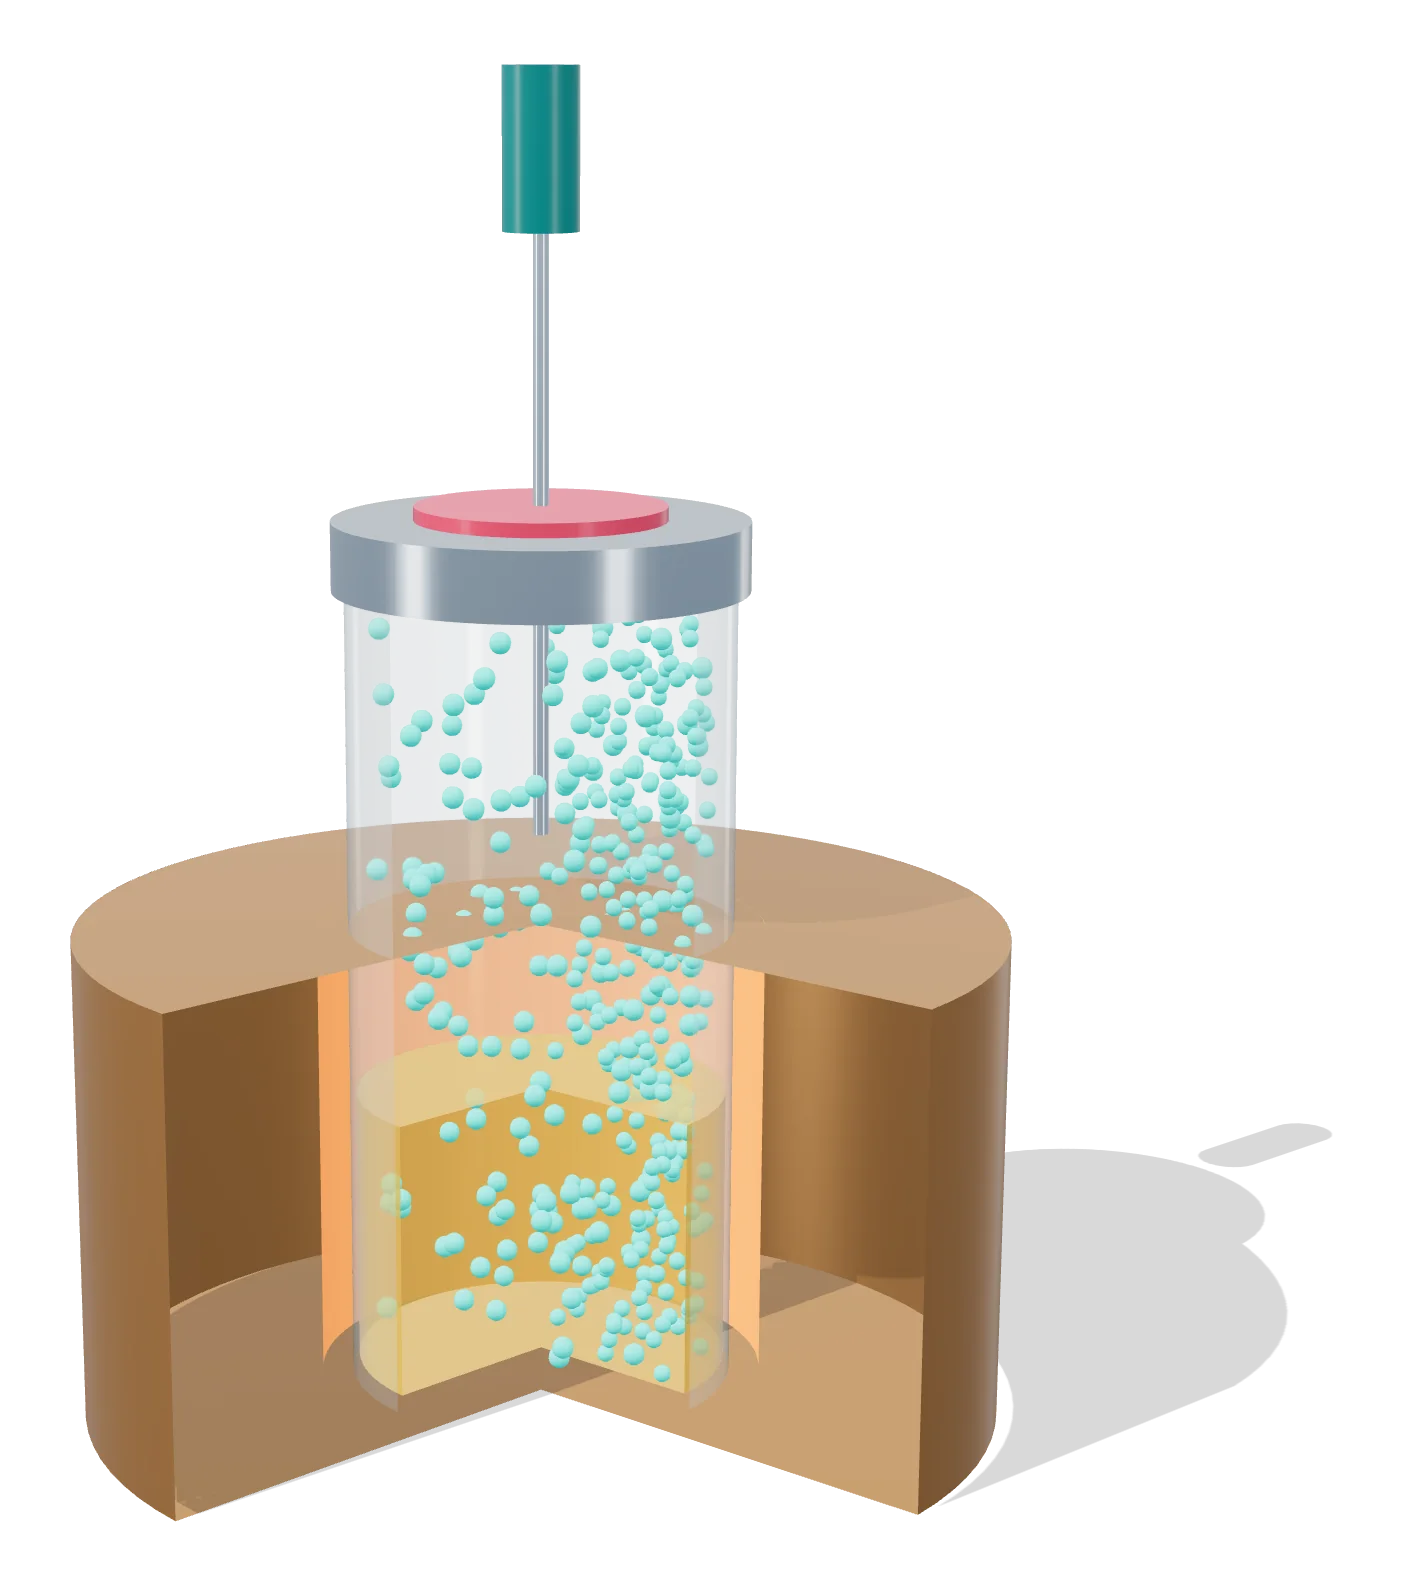
- 1 Sealed vial, heated to equilibrium
- 2 Sample: solvents partition into the gas
- 3 Headspace gas
- 4 Needle draws the gas to the GC
- 5 Heater block
Rendered by EUTECNIQ; schematic, a generic instrument. EUTECNIQ has no equipment yet.
ICP-MS and ICP-OES
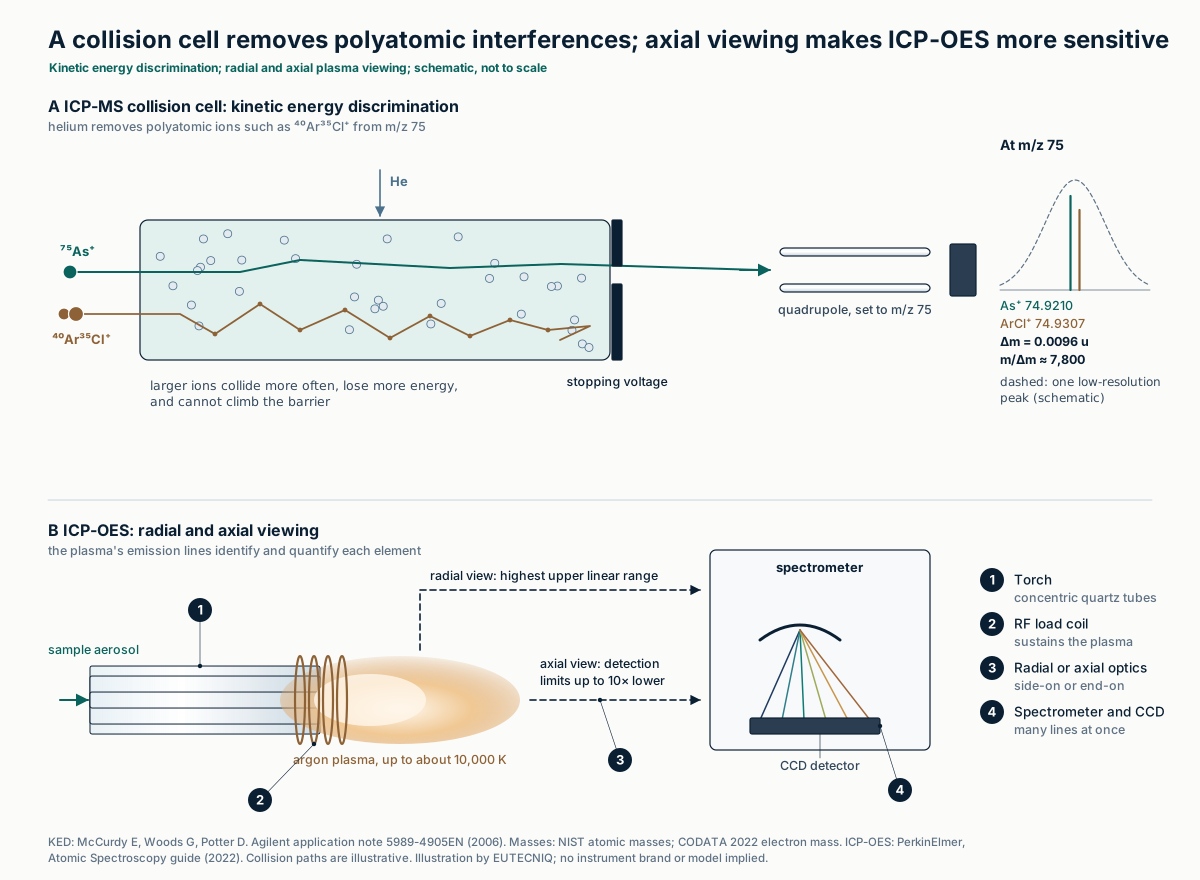
Both techniques feed a digested sample into an argon plasma of up to about 10,000 K. ICP-OES measures the light each element emits at its own wavelengths; viewing the plasma end-on (axially) lowers detection limits by up to tenfold against side-on viewing. ICP-MS counts ions by m/z and reaches far lower limits.
Its weakness is polyatomic interference: ⁴⁰Ar³⁵Cl⁺ lies 0.0096 u from ⁷⁵As⁺, needing a resolving power near 7,800. A helium collision cell removes such ions by kinetic energy discrimination (KED).
| Element | ICP-OES (axial), µg/L | ICP-MS, µg/L | ICP-OES limit in the solid at 100 mL/g, µg/g | ICH Q3D oral limit at 10 g/day, µg/g |
|---|---|---|---|---|
| Arsenic | 1.0 | 0.00005 | 0.10 | 1.5 (inorganic) |
| Cadmium | 0.1 | 0.00006 | 0.01 | 0.5 |
| Lead | 1.3 | 0.00001 | 0.13 | 0.5 |
| Mercury | 1.0 | 0.001 | 0.10 | 3 (inorganic) |
Detection limits: PerkinElmer. Atomic Spectroscopy: A Guide to Selecting the Appropriate Technique and System; 2022 (publication 870567), elemental standards in dilute aqueous solution, 3 standard deviations; values for clean aqueous standards, not limits in a botanical matrix. Solid-content column: computed here for an assumed 0.5 g digested and made up to 50 mL; quantitation limits are higher than detection limits. ICH Q3D(R2) (2022), oral concentration Option 1. Interference arithmetic: NIST atomic masses (⁴⁰Ar 39.9623831237, ³⁵Cl 34.968852682, ⁷⁵As 74.92159457 u).
| USP ⟨233⟩ criterion | Limit procedure | Quantitative procedure |
|---|---|---|
| Procedures named | Procedure 1: ICP-OES (ICP-AES); Procedure 2: ICP-MS | |
| Detectability or accuracy | Spike at the target concentration: mean of 3 within ±15% of the standard; a spike at 80% must read below it | Spikes at 50–150% of J: mean recovery 70–150% at each level |
| Repeatability | 6 spiked samples, RSD ≤ 20% | 6 samples, RSD ≤ 20% |
| Intermediate precision | Not required | Different day, instrument or analyst; 12 results, RSD ≤ 25% |
| Specificity | Each target element assessed unequivocally in the presence of the others and of the matrix | |
USP ⟨233⟩ Elemental Impurities—Procedures (USP 38–NF 33 text). KED: McCurdy E, Woods G, Potter D. Agilent Technologies application note 5989-4905EN; 2006 ("all polyatomics are larger than analyte ions of the same mass"). ICP-OES viewing: PerkinElmer 2022. The full ICP-MS ion path is drawn on the analytical technologies page.

- 1 Nebulizer and spray chamber
- 2 Torch and load coil
- 3 Argon plasma
- 4 Sampler and skimmer cones
- 5 Collision cell
- 6 Quadrupole mass filter
Rendered by EUTECNIQ; schematic, a generic instrument. EUTECNIQ has no equipment yet.
NMR and quantitative NMR
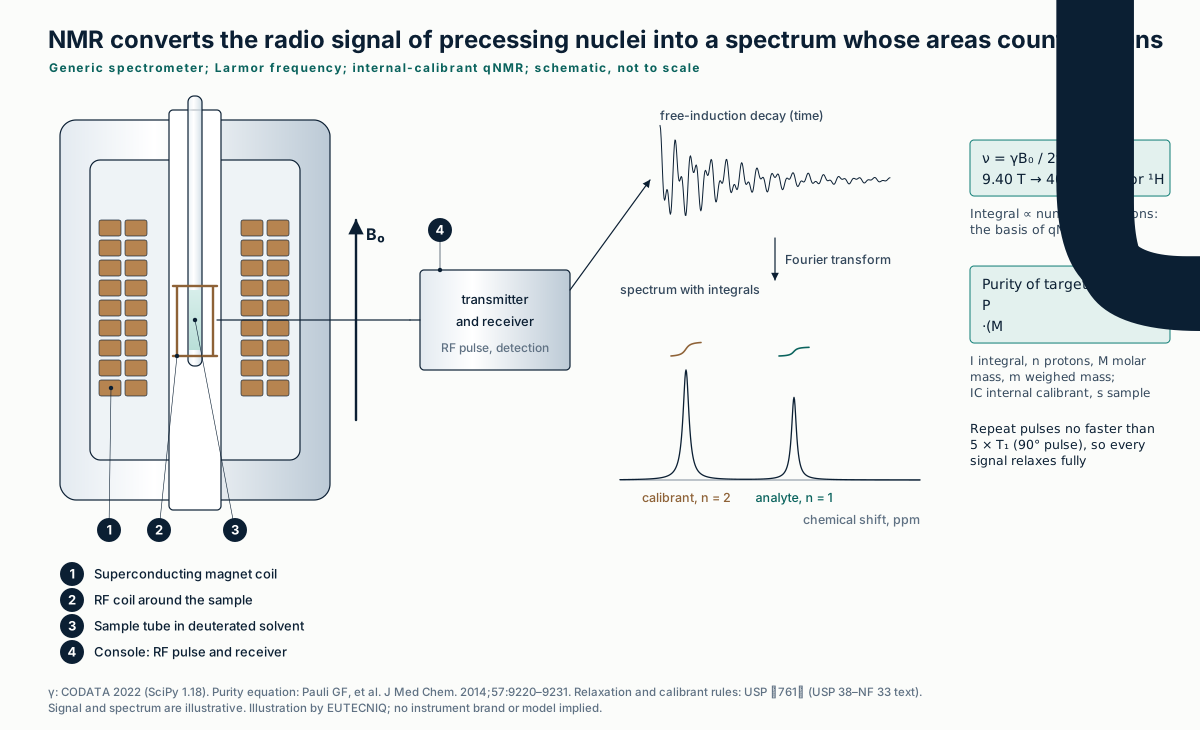
In a magnetic field B₀, ¹H nuclei precess at the Larmor frequency, about 400 MHz at 9.4 T. A radio-frequency pulse tips them; the decaying signal they induce in the coil is Fourier transformed into a spectrum in which chemically distinct protons appear at their own chemical shifts.
Because a signal's integral is proportional to the number of nuclei behind it, qNMR is a primary ratio method: a weighed internal calibrant of known purity gives the analyte's purity without a reference standard of the analyte.
| Field B₀, T | 7.05 | 9.40 | 11.74 | 14.09 | 18.79 |
|---|---|---|---|---|---|
| ¹H frequency, MHz | 300.2 | 400.2 | 499.9 | 599.9 | 800.0 |
Computed with γp/2π = 42.577478461 MHz/T (CODATA 2022, free proton, via SciPy 1.18); chemical shielding shifts real resonances by parts per million.
| qNMR element | Requirement or property | Source |
|---|---|---|
| Relaxation | Pulse repetition time at least 5 times the longest T₁ when a 90° pulse is used | USP ⟨761⟩ |
| Internal standard | At least one resonance that does not overlap the analyte; known number of nuclei for each integrated peak | USP ⟨761⟩ |
| Main error source | Weighing; larger weights recommended; typically at least three replicate preparations | USP ⟨761⟩ |
| Signal-to-noise | S/N = 2.5 × A/H × k; specifications typically 20–1000 | USP ⟨761⟩ |
| Dynamic range | Integrals are linear in molar amount; dynamic range can exceed 10⁴ within minutes | Pauli et al. 2014 |
| Built-in threshold | ¹³C satellites (natural ¹³C 1.091–1.110%) mark about a 0.5% level per proton for spotting minor impurities | Pauli et al. 2014 |
USP ⟨761⟩ Nuclear Magnetic Resonance Spectroscopy (USP 38–NF 33 text). Pauli GF, et al. Importance of purity evaluation and the potential of quantitative ¹H NMR as a purity assay. J Med Chem. 2014;57(22):9220–9231 (purity equation, internal-calibration method).
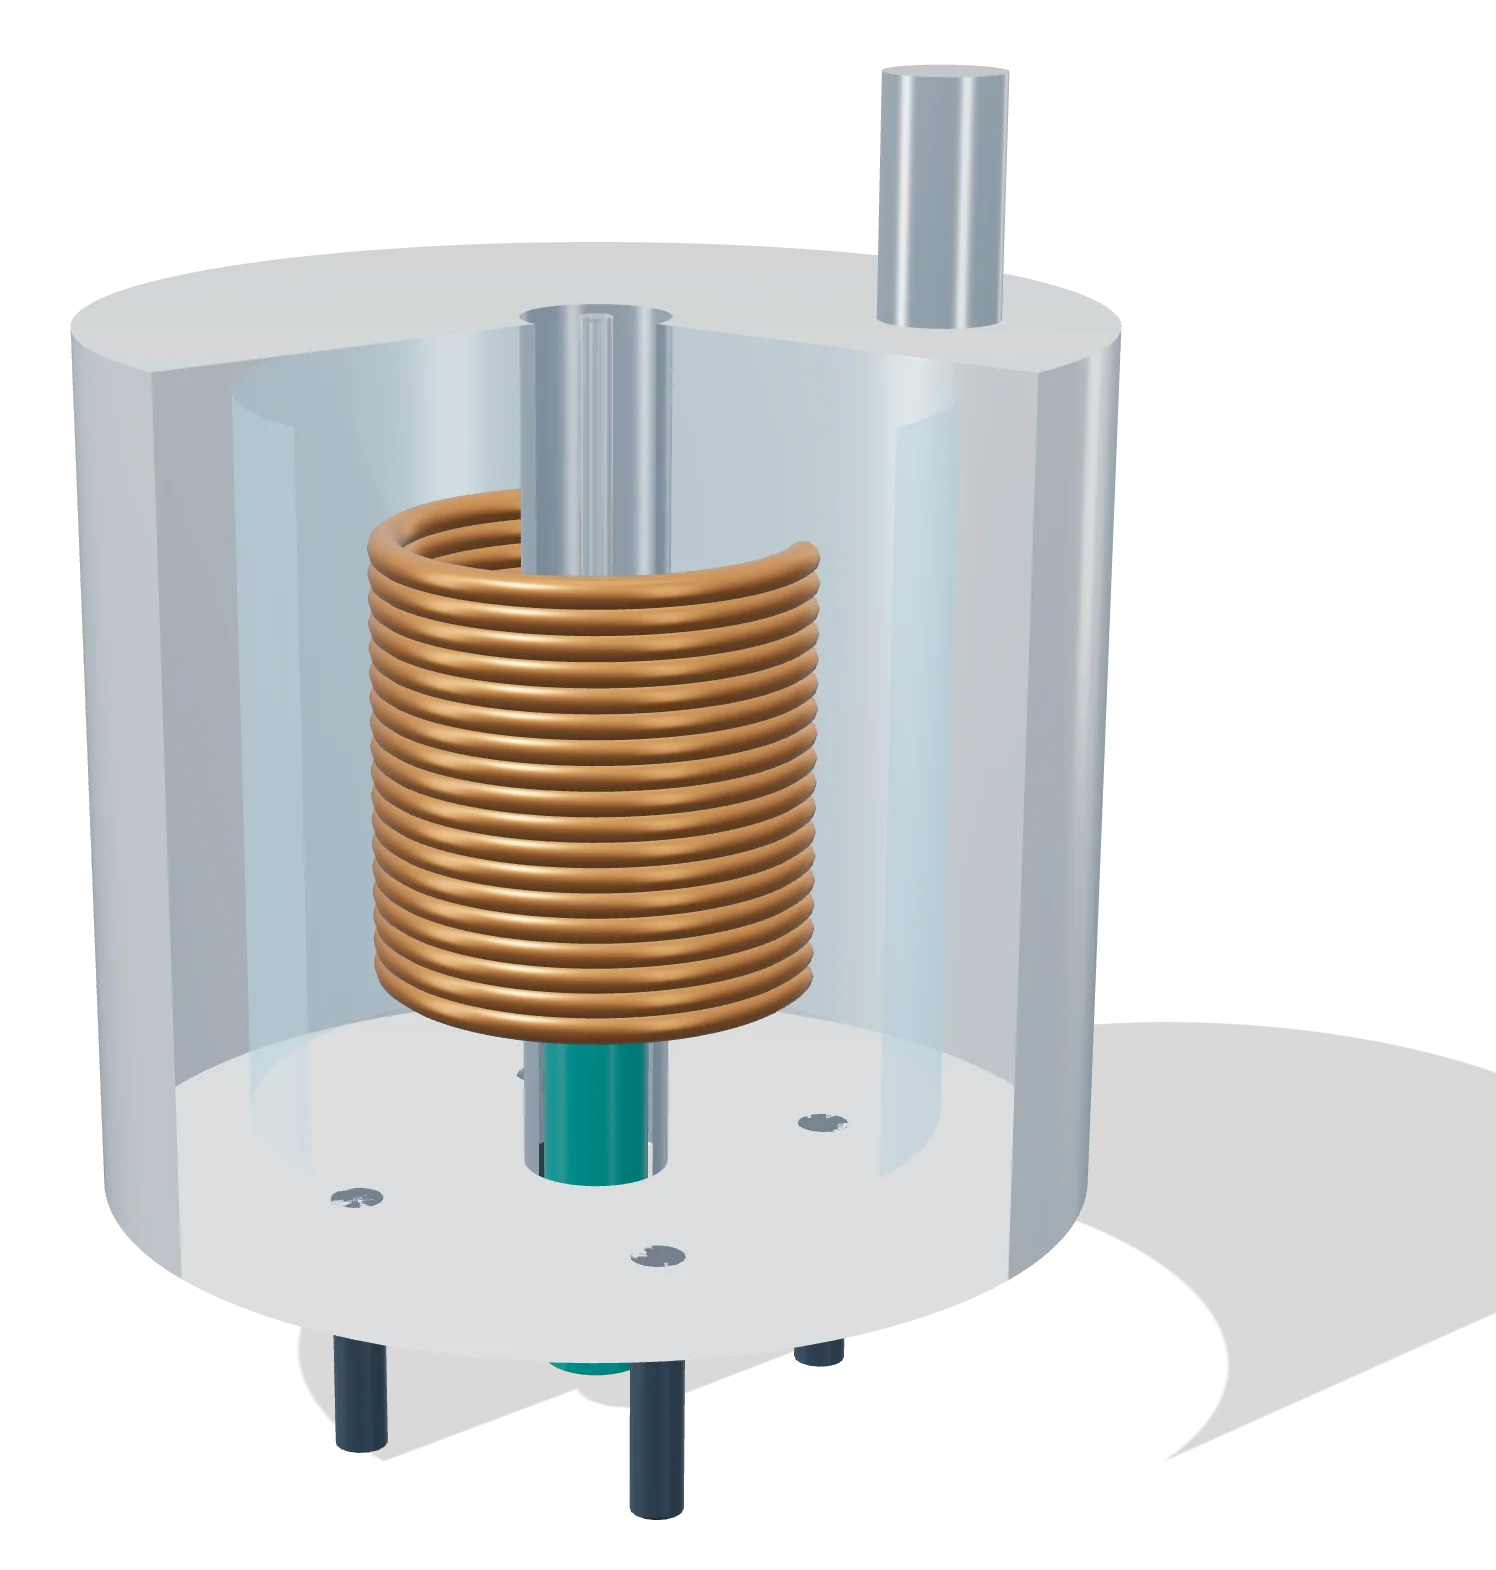
- 1 Superconducting coil in liquid helium
- 2 Cryostat
- 3 Sample tube at the field center
- 4 Probe: radiofrequency coil, inserted from below
Rendered by EUTECNIQ; schematic, a generic instrument. EUTECNIQ has no equipment yet.
Infrared and HPTLC fingerprints
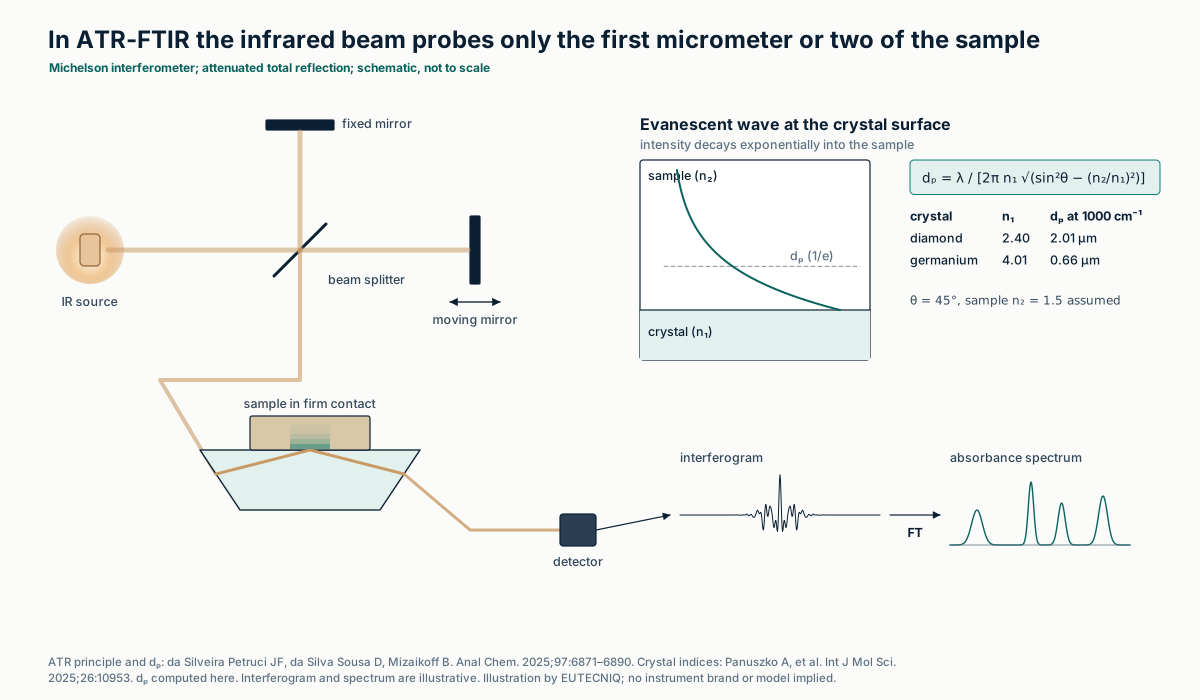
Infrared spectra record molecular vibrations. In attenuated total reflection (ATR), the beam reflects inside a crystal and an evanescent wave probes only a surface layer one or two micrometers deep. Near-infrared overtone and combination bands overlap, so identity is judged with multivariate models, for example one-class PCA models built only from authentic samples.
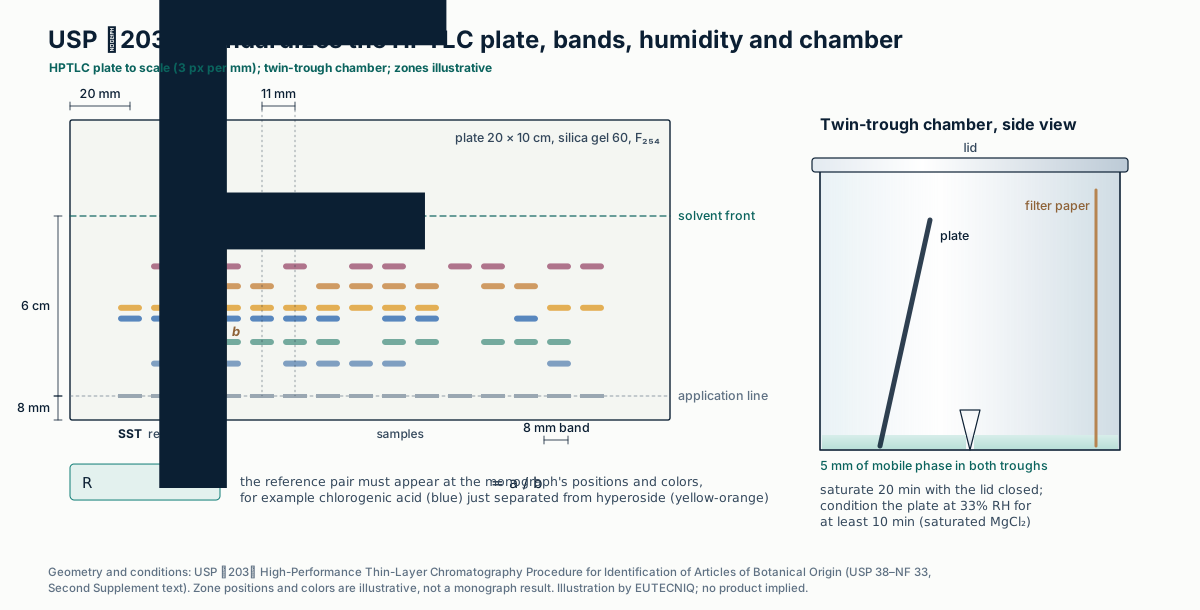
HPTLC separates an extract on a silica plate and compares zone position, color and intensity with a reference. USP ⟨203⟩ fixes the plate, application, humidity, chamber and development so that plates compare between laboratories.
| USP ⟨203⟩ step | Default condition (unless the monograph states otherwise) |
|---|---|
| Plate | 20 × 10 cm plate, glass preferred; 200 µm porous silica gel layer, 60 Å pores; irregular particles 2–10 µm, average 5 µm; F₂₅₄ indicator |
| Sample | 100 mg powdered botanical (10 mg of dry extract) sonicated 15 min with 1 mL methanol, then centrifuged |
| Application | Bands 8.0 ± 0.5 mm long, 8.0 ± 0.5 mm from the lower edge; tracks at least 11.0 ± 0.5 mm apart; usually 2.0–10.0 µL |
| Conditioning | At least 10 min at 33% relative humidity (for example over saturated magnesium chloride) |
| Development | Twin-trough chamber with filter paper; 5 mm solvent in both troughs; 20 min saturation; development path 6 cm; dry in cold air |
| Detection | UV 254 nm, UV 366 nm and white light, before and/or after derivatization |
| System suitability | Two or more reference substances with similar but separable RF; position, color and resolution must match the monograph |
USP ⟨203⟩ High-Performance Thin-Layer Chromatography Procedure for Identification of Articles of Botanical Origin (USP 38–NF 33, Second Supplement text). Numeric RF acceptance criteria come from individual monographs. One-class models: Harnly J. Front Pharmacol. 2025;16:1504230. Visible–near-infrared models for ginger adulterated with flours were calibrated over 5–50% adulterant: Amine R, et al. Molecules. 2026;31(17):3091.
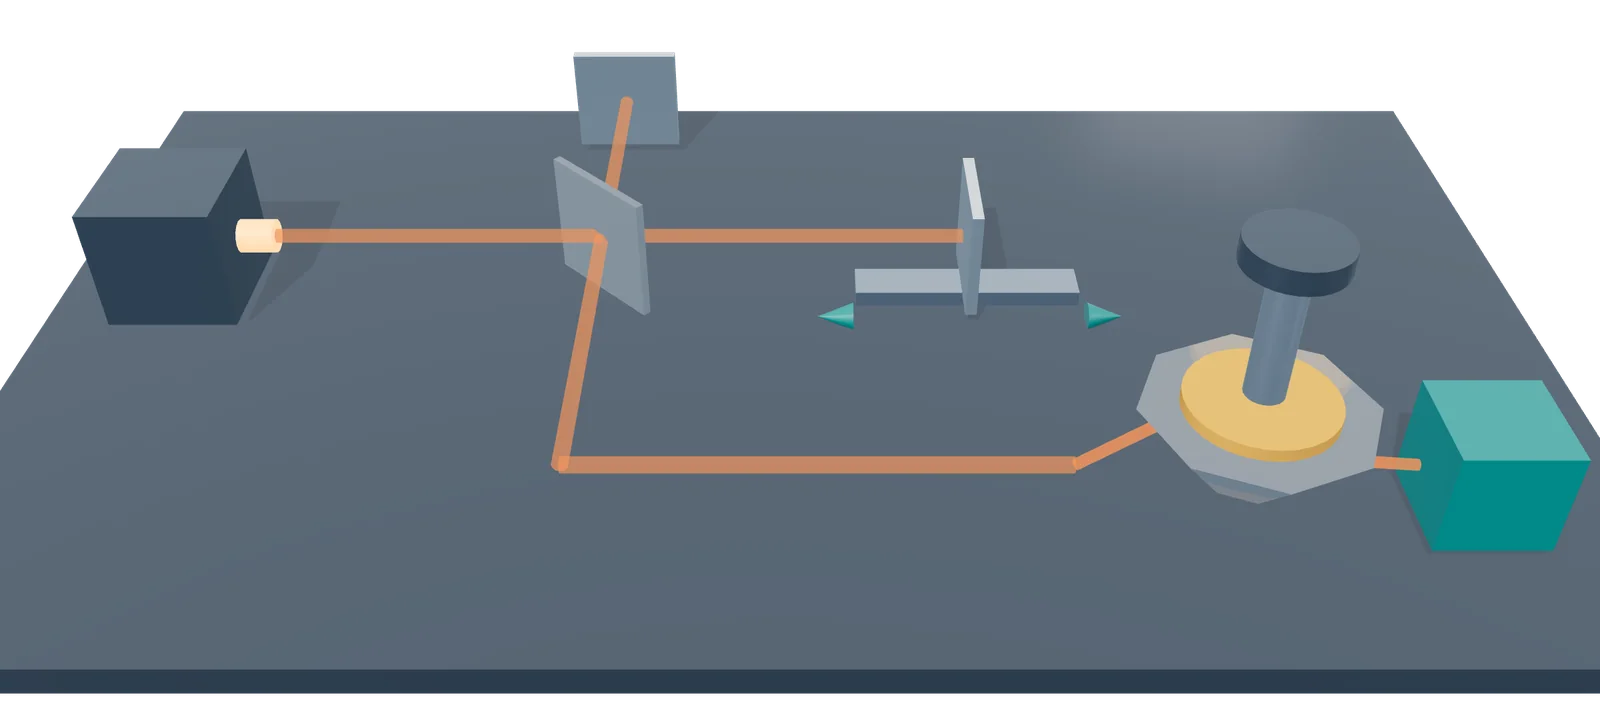
- 1 Infrared source
- 2 Beam splitter
- 3 Fixed mirror
- 4 Moving mirror
- 5 ATR diamond, sample pressed on top
- 6 Detector
Rendered by EUTECNIQ; schematic, a generic instrument. EUTECNIQ has no equipment yet.
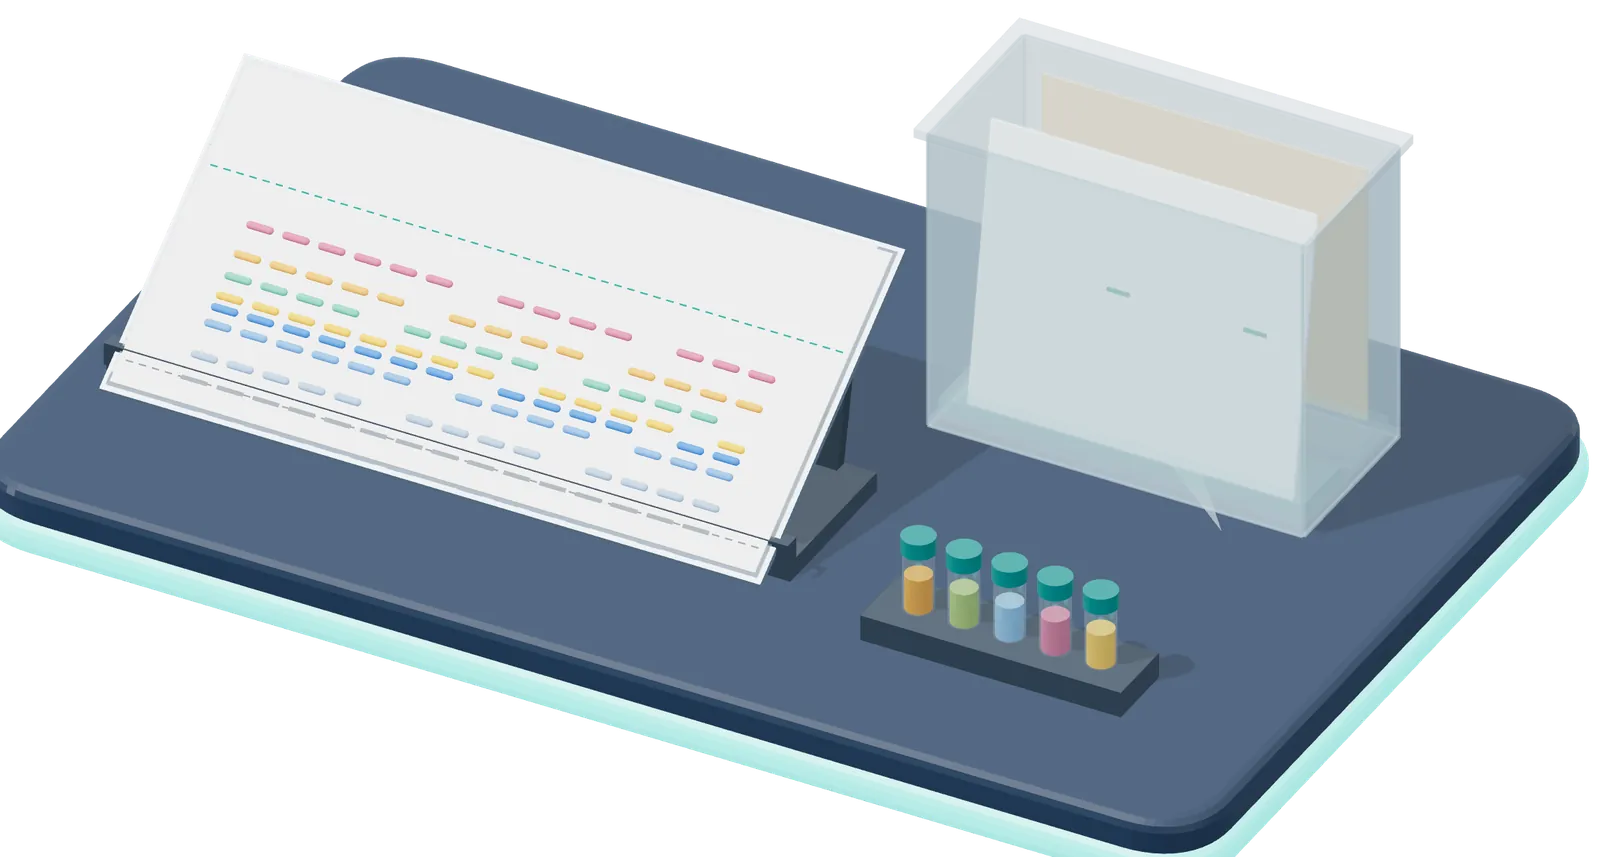
- 1 HPTLC plate, 20 × 10 cm
- 2 Twin-trough chamber
- 3 Samples and references
3D rendering by EUTECNIQ, schematic. The drawing below gives the details, values and sources. EUTECNIQ has no equipment yet.
Particle size and surface charge
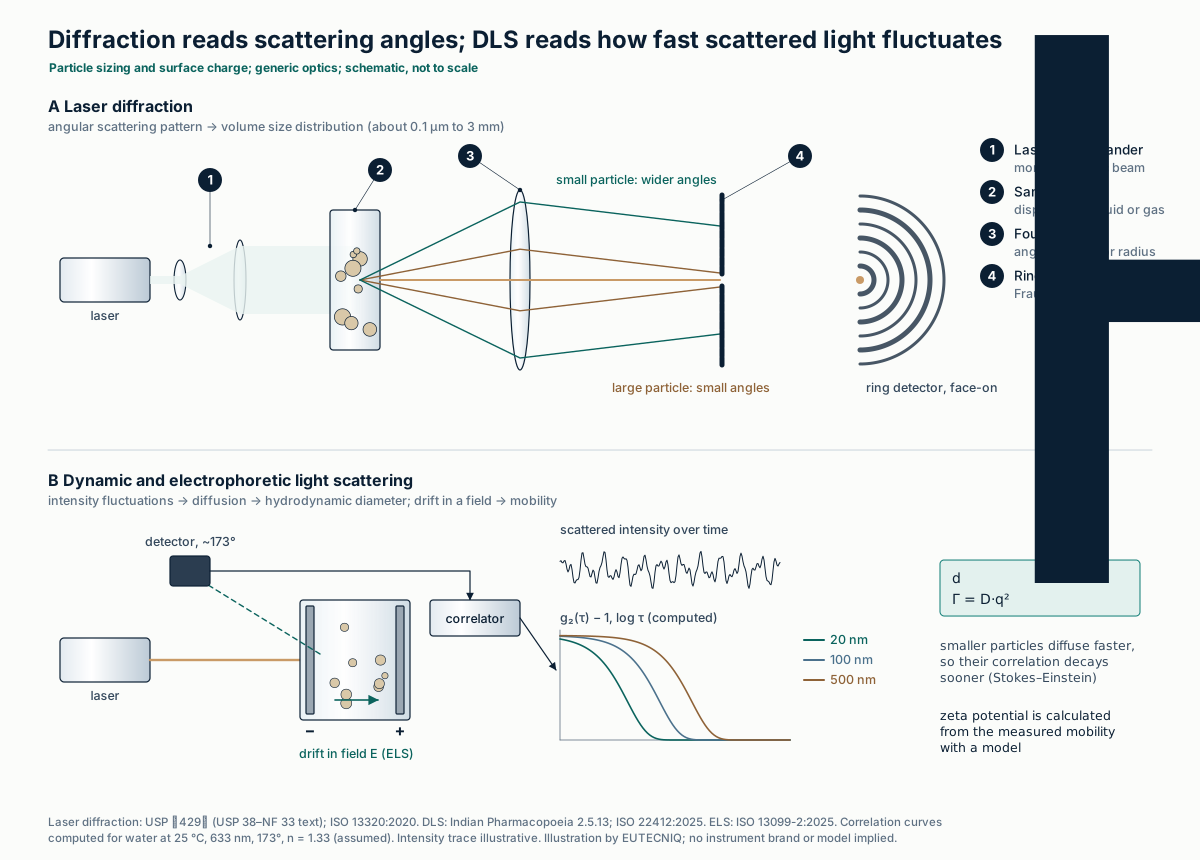
Laser diffraction converts the angular pattern of light scattered by a dispersed sample into a volume-weighted size distribution. Dynamic light scattering (DLS) follows how fast the scattered intensity fluctuates as particles diffuse; the decay of its autocorrelation gives the diffusion coefficient and, through Stokes–Einstein, a hydrodynamic diameter.
Zeta potential is not measured directly. Electrophoretic light scattering measures mobility in an applied field, and a model (Hückel, Henry or Smoluchowski) converts it, each valid only over a range of particle size relative to the double-layer thickness.
| Method | Reports | Range or validity | Published acceptance practice |
|---|---|---|---|
| Laser diffraction (ISO 13320:2020; USP ⟨429⟩) | Volume distribution as equivalent spheres: x10, x50 (median), x90 | About 0.1 µm to 3 mm; Fraunhofer needs no refractive index; Mie needs it and is less biased for small particles | Aim for RSD ≤ 10% at x50 and ≤ 15% at x10 and x90 (n = 6); double these below 10 µm |
| DLS (ISO 22412:2025) | Intensity-weighted harmonic mean (z-average) and polydispersity index | Mainly submicrometer; "particularly suitable" up to about 1 µm (IP 2.5.13) | About 100 nm latex check: within the certified range ± 2%, PDI ≤ 0.1, RSD ≤ 2% (n ≥ 5); method RSD ≤ 10% (n ≥ 3) |
| Electrophoretic light scattering (ISO 13099-2:2025) | Electrophoretic mobility, converted to zeta potential by a model | Classical models need κa in a set range and low zeta; they neglect surface conductivity | Report the model used and the medium's conductivity and pH (good practice) |
ISO 13320:2020 and ISO 22412:2025, ISO 13099-2:2025 (abstracts, iso.org). USP ⟨429⟩ Light Diffraction Measurement of Particle Size (USP 38–NF 33 text). Indian Pharmacopoeia 2.5.13 Particle size analysis by dynamic light scattering (harmonized text). Frangenberg M, Schmidt AM, Wilkens J. Langmuir. 2025;41(8):5188–5201 (limits of Hückel, Henry and Smoluchowski). The last cell of the table is editorial advice, not a cited requirement. Double-layer potential profiles are drawn on the emulsions and colloids page.
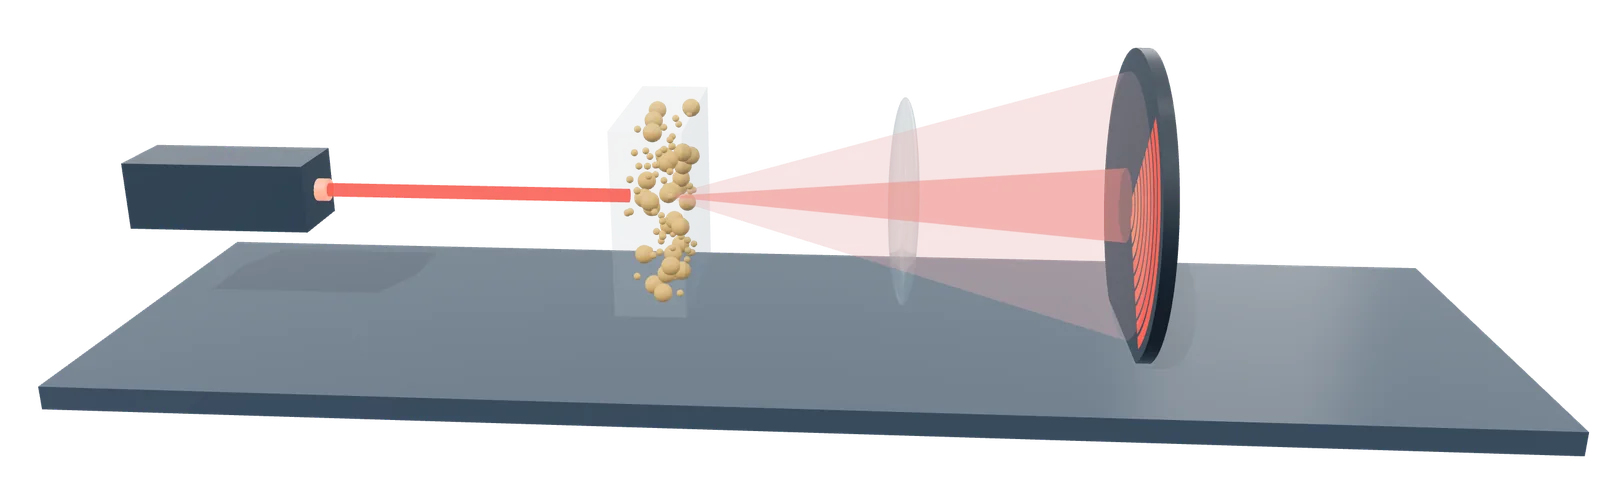
- 1 Laser
- 2 Particles dispersed in the cell
- 3 Large particles scatter to narrow angles, small ones wide
- 4 Ring detector records intensity by angle
Rendered by EUTECNIQ; schematic, a generic instrument. EUTECNIQ has no equipment yet.
The techniques compared
No technique answers every question. Detection limits depend on the analyte, matrix and method, so the values below are published examples with their sources, not specifications; a dash means no general value is given here.
Targeted methods quantify named compounds against reference standards. Non-targeted methods screen for unknowns and report candidates with a confidence level; see targeted and non-targeted analysis.
| Technique | What it measures | Typical use in botanicals | Selectivity | Published detection example | Sample preparation |
|---|---|---|---|---|---|
| HPLC / UHPLC-DAD | UV-visible absorbance over time, with a spectrum at each point | Assay of marker compounds | Retention time plus UV spectrum; co-elution possible | LOD 0.70–0.83 µg/mL for five biflavonoids [1] | Solvent extraction, filtration, dilution |
| LC-MS/MS (triple quadrupole, MRM) | Selected precursor → product ion pairs | Trace contaminants (for example pyrrolizidine alkaloids); low-level markers | Retention time plus two transitions | LOD 0.03–0.75 µg/kg for 24 alkaloids in tea [2] | Extraction and clean-up validated for the matrix |
| LC-HRMS (Q-TOF, Orbitrap) | Accurate m/z (ppm) and MS/MS spectra | Profiling, unknowns, adulterant screening | Accurate mass, isotope pattern, fragments | — | As for LC |
| GC-MS (EI, 70 eV) | Fragment pattern plus retention index | Essential oils and other volatiles | Library match confirmed by retention index | — | Dilution, or derivatization of polar compounds [3] |
| GC-FID | Ion current from combustion in a hydrogen flame | Volatile composition; residual solvents | Retention time only | Below 1 ppmv "easily detected" in gas samples [4] | Dilution or headspace |
| Headspace GC-FID (USP ⟨467⟩) | Volatiles in the vapor above the sample | Residual solvents | Retention on two different phases (G43, G16) | Suitability: S/N ≥ 3 for each Class 1 solvent peak [5] | Dissolve in water, seal, equilibrate 45–60 min |
| ICP-MS | Ions counted by m/z | Lead, cadmium, arsenic, mercury | m/z; polyatomic ions need a cell | 0.00001–0.001 µg/L in solution for Pb, Cd, As, Hg [6] | Acid digestion |
| ICP-OES | Element-specific emission lines | Minerals and elements at higher levels | Emission wavelength; spectral overlaps possible | 0.1–1.3 µg/L (axial) for the same four elements [6] | Acid digestion |
| qNMR (¹H) | Integrals of proton signals | Purity of isolates and reference materials | Chemical shift; overlap in mixtures | ¹³C satellites mark about 0.5%; dynamic range above 10⁴ [7] | Weighed sample and calibrant in deuterated solvent |
| FTIR-ATR | Mid-infrared absorption of a 1–2 µm surface layer | Identity of raw materials and extracts | Whole-sample fingerprint; weak for minor components | — | Little or none; firm contact with the crystal |
| Near-infrared | Overtone and combination bands | Fast identity screening | Through a multivariate model only | Adulterant models calibrated over 5–50% (ginger, visible–NIR) [8] | Little or none |
| HPTLC (USP ⟨203⟩) | Zone pattern after development and derivatization | Botanical identity against a reference | RF, color and relative intensity | LOD 9.7–35.6 ng per band for four phenolics [9] | 100 mg powder, 1 mL methanol, sonicate 15 min |
| Laser diffraction | Angular light-scattering pattern | Powders, granules, spray-dried particles | Not chemical | Size range about 0.1 µm–3 mm [10] | Dispersion in a liquid or gas |
| DLS and zeta potential | Intensity fluctuations; electrophoretic mobility | Emulsions, nanoemulsions, colloids | Not chemical | Up to about 1 µm [11] | Dilution in a stated medium |
[1] El-Natory ZG, et al. Sci Rep. 2026, doi:10.1038/s41598-026-60998-6 (HPLC-DAD, Table 1). [2] Lin et al. 2025. [3] McGlynn et al. 2025 (trimethylsilyl derivatives). [4] IUPAC Gold Book F02410. [5] USP ⟨467⟩. [6] PerkinElmer 2022, dilute aqueous standards. [7] Pauli et al. 2014. [8] Amine et al. 2026. [9] Alam P, et al. Pharm Biol. 2017;55(1):1317–1323 (rutin, quercetin, naringenin, gallic acid). [10] ISO 13320:2020. [11] Indian Pharmacopoeia 2.5.13. Unbracketed cells are general descriptions of the technique.
Identity testing for botanicals
Under 21 CFR 111.75(a)(1)(i), a manufacturer must conduct at least one appropriate test or examination to verify the identity of every dietary-ingredient component before use; the only exemption is an FDA-granted petition for alternative testing under (a)(1)(ii). USP ⟨563⟩ combines botanical (macroscopic, microscopic) and chemical identification.
DNA methods identify species, but processing breaks DNA into short fragments. In 1,242 samples, DNA barcoding failed in 90% of extracts.
| Source | What it says |
|---|---|
| 21 CFR 111.75(a)(1)(i) | At least one appropriate test or examination to verify the identity of any component that is a dietary ingredient |
| 21 CFR 111.75(a)(1)(ii) | Exemption only by citizen petition (21 CFR 10.30) showing "no material diminution of assurance" compared with 100 percent identity testing |
| 21 CFR 111.75(a)(2) | Other components: test, or rely on a certificate of analysis from a qualified supplier whose results have been confirmed and are periodically re-confirmed |
| USP ⟨563⟩ | Botanical identification (morphology, anatomy, microscopy) and chemical identification (UV, IR, FTIR, HPLC, TLC, 2D-TLC, GC) against USP reference articles; no DNA method |
| AOAC botanical identification guideline | A yes/no method validated for inclusivity (accepts variants of the target) and exclusivity (rejects look-alikes), with superior and inferior test mixtures and a probability of identification |
| Statistical burden | The probability-of-identification design calls for 60 analyses (30 authentic, 30 adulterated) for 95% confidence; AOAC has charged an expert panel with new guidelines |
eCFR, 21 CFR 111.75, up to date as of October 23, 2026. USP ⟨563⟩ Identification of Articles of Botanical Origin (USP 35–NF 30 text; later revisions not reviewed here). AOAC International Guideline Working Group. J AOAC Int. 2012;95(1):268–272. Harnly J. Front Pharmacol. 2025;16:1504230.
| Measure (1,242 samples, 275 species) | Raw material | Extract |
|---|---|---|
| DNA quantity, ng/µL | Mostly over 50 (up to 120) | 0.1–10.0 |
| Typical fragment length, bp | 400–500 | 50–150 |
| DNA barcoding (rbcL, matK) | Failed to identify 25% | Failed in 90% |
| Next-generation sequencing | Incidental contaminant DNA called the main ingredient in 7% | Same error in 41% of extracts successfully sequenced |
| Targeted PCR (DNA probes) | — | Positive for 76% of extracts, including some with no measurable DNA |
Ragupathy S, et al. Exploring DNA quantity and quality from raw materials to botanical extracts. Heliyon. 2019;5(6):e01935 (open access); 3% of samples gave no measurable DNA. A positive DNA test shows that DNA of a species is present; it does not show how much of the material is that species, nor whether a purified or synthetic compound was added.
Method validation
ICH Q2(R2), adopted on November 1, 2023, sets the performance characteristics a validation must show for each type of procedure; robustness is studied during development under ICH Q14. Detection and quantitation limits may come from signal-to-noise (3:1 and 10:1) or from the calibration (3.3σ/S and 10σ/S).
AOAC sets standard method performance requirements (SMPRs) for a named analyte and matrix. The worked example is on the method development page.
| Characteristic | Identity | Impurity, quantitative | Impurity, limit test | Assay (content or potency) |
|---|---|---|---|---|
| Specificity / selectivity | Yes | Yes | Yes | Yes |
| Response (calibration model) | No | Yes | No | Yes |
| Lower range limit | No | QL (DL in some cases) | DL | No |
| Accuracy | No | Yes | No | Yes |
| Repeatability | No | Yes | No | Yes |
| Intermediate precision | No | Yes (not needed separately if derived from reproducibility data) | No | Yes (same condition) |
ICH Q2(R2) Validation of Analytical Procedures, Step 4, November 1, 2023, Table 1 (summarized; check the guideline for the footnotes, including the option of a combined accuracy-and-precision approach). Also from Q2(R2): assay reportable range typically 80–120% of the declared content; accuracy assessed, for example, at 3 concentrations with 3 replicates each and reported with a confidence interval; repeatability from at least 9 determinations across the range or at least 6 at 100% of the test concentration. AOAC SMPR definition: AOAC botanical identification guideline, 2012, § 3.18.
Where EUTECNIQ would work
EUTECNIQ has no laboratory yet. Once equipped, it would pair each botanical question with an orthogonal set of the methods above, validate or verify them for the matrix under ICH Q2(R2), and keep identity testing under 21 CFR 111.75. Until then, qualified external laboratories would run all testing.
Related: Analytical technologies · Method development · Targeted and non-targeted analysis · Emulsions and colloids · Quality standards · Academy: certificate-of-analysis science
Health information notice
These statements have not been evaluated by the Food and Drug Administration. Nothing on this site is intended to diagnose, treat, cure or prevent any disease. The information is for general education only. It is not medical advice and does not replace advice, diagnosis or treatment from a qualified health professional, or any medication a clinician has prescribed.
Do not start, stop or change any medicine, supplement or herbal product because of something you read here. Talk to your doctor or pharmacist first, especially if you are pregnant or breastfeeding, have a medical condition, take any medicines, are preparing for surgery, or are caring for a child. Research findings, traditional uses and safety data are reported as their sources state them; they are not recommendations or claims about any product. If you think you may have a medical emergency, call your doctor or 911 at once.
EUTECNIQ Sciences sells no supplements or health products today and receives nothing from any product or ingredient mentioned on this site; any commercial interest it later has in an ingredient will be stated on that ingredient’s page.