

Toxicity and exposure models, and the one question each answers
Liver-injury scales, pharmacokinetic and population models, mechanistic liver simulators, structure-based hazard tools, dose–response software, an emissions model and fluid dynamics. For each: what it answers, what goes in and comes out, who maintains it, what regulators say about it and where it stops.
FDA, DILIrank dataset page (modified April 2, 2026); FDA, Drug-Induced Liver Injury: Premarketing Clinical Evaluation (July 2009); OECD (Q)SAR validation principles (2004); Pearce et al., J Stat Softw 2017;79(4).
Status. Education, not medical advice. EUTECNIQ runs none of these models. The population simulation on this page is an educational calculation from published parameters, not a measurement or a prediction for any product.
Related: ADME, PK and PBPK · Academy: toxicology and dose · Toxicology and exposure assessment · Toxicology and risk assessment
Each model answers one kind of question, and none of them alone decides that a product is safe
A causality scale judges one patient's injury. A pharmacokinetic model predicts concentrations. A hazard tool flags a structure. Safety conclusions combine several of these with exposure and the actual studies; the course on toxicology and dose shows how.
Text version: the eight questions
- Liver-injury cause or signal: LiverTox likelihood scale, RUCAM, FDA Hy's law, FDA DILIrank; DILIsym contributes simulated enzyme and bilirubin rises.
- Exposure over time: compartmental PK and PK/PD, population PK, PBPK platforms, US EPA httk.
- Variability between people: population PK; PBPK platforms, httk and DILIsym contribute through simulated populations.
- Mechanism of toxicity: DILIsym, adverse outcome pathways; ToxCast and Tox21 contribute target-level activity.
- Hazard without new animal data: (Q)SAR, read-across, threshold of toxicological concern, ToxCast and Tox21; httk and adverse outcome pathways contribute.
- Dose for a set response: benchmark-dose modeling (US EPA BMDS, EFSA guidance).
- Impact per kg emitted: USEtox, in life-cycle assessment.
- Flow and mixing in organs: computational fluid dynamics of the stomach and airways.
Whether a product caused a liver injury is judged with expert scales, not with a laboratory test
Drug-induced liver injury is a diagnosis of exclusion. LiverTox, published by the U.S. National Institute of Diabetes and Digestive and Kidney Diseases (NIDDK) on the NLM Bookshelf, covers prescription and nonprescription drugs and selected herbal and dietary supplements, and grades each agent on a likelihood scale.
| Category | Meaning | Evidence behind it |
|---|---|---|
| A | Well known cause of liver injury | Characteristic signature; more than 50 reported cases, including case series |
| B | Known or highly likely cause of idiosyncratic injury | Characteristic signature; 12 to 50 cases, including small case series |
| C | Probable cause | Uncommon reports; no characteristic signature; fewer than 12 cases without significant case series |
| D | Possible, rare cause | Single case reports; fewer than 3 cases in the literature |
| E | Not believed or unlikely to cause injury | No evidence despite extensive use; any single case reports largely unconvincing |
| E* | Suspected, unproven | No convincing cases in the literature |
| X | Unknown | Inadequate information on risk, for an agent recently introduced or rarely used |
LiverTox, Categorization of the Likelihood of Drug Induced Liver Injury, updated May 4, 2019 (NBK548392). Agents that injure the liver only at high doses, typically overdoses, carry the suffix [HD] after category A, B, C or D; LiverTox's examples are aspirin, acetaminophen, niacin and vitamin A. LiverTox grades green tea “A (well established cause of clinically apparent liver injury)” (entry updated November 20, 2020); see Green tea and the course section on botanical liver injury.
Causality in one patient: DILIN expert opinion and RUCAM
In the U.S. Drug-Induced Liver Injury Network (DILIN), three experts grade each case independently on five levels tied to a likelihood: definite (above 95%), very likely (75–95%), probable (50–75%), possible (25–50%) and unlikely (below 25%). Disagreements are reconciled in a meeting.
RUCAM, the Roussel Uclaf Causality Assessment Method, was introduced in 1993 by Danan and Benichou. It scores each suspect agent on seven items: time to onset, course after stopping, risk factors, concomitant drugs, non-drug causes, prior information on the agent's hepatotoxicity and response to re-exposure. Danan and Teschke published an update in 2016 for drug- and herb-induced liver injury.
| Step | Rule |
|---|---|
| Injury pattern | R = (ALT ÷ ALT upper limit of normal) ÷ (alkaline phosphatase ÷ its upper limit of normal), from the first abnormal test. R above 5: hepatocellular; 2 to 5: mixed (scored as cholestatic); below 2: cholestatic |
| Score range | −9 to +14 in theory; −7 to +11 without re-exposure |
| Causality | ≤ 0 excluded · 1–2 unlikely · 3–5 possible · 6–8 probable · above 8 highly probable (LiverTox's RUCAM chapter; its Causality chapter gives 3 or below as unlikely and 4–5 as possible) |
LiverTox, Causality, updated November 20, 2019 (NBK548049); LiverTox, Roussel Uclaf Causality Assessment Method (RUCAM) in Drug Induced Liver Injury, updated May 4, 2019 (NBK548272); Danan G, Teschke R. Int J Mol Sci 2016;17(1):14.
Limits stated by LiverTox: some RUCAM descriptions are ambiguous and are interpreted differently by different users; alcohol use is not defined, and what counts as a compatible time to onset for a concomitant drug is unclear; ALT upper limits vary by laboratory, age and sex; for cholestatic and mixed injury the score range is narrower, so often only “probable” can be assigned; and RUCAM gives no instructions for the R ratio in pre-existing liver disease.
Signals across a trial or a drug list: Hy's law and DILIrank
FDA's 2009 guidance defines a Hy's law case by three findings: ALT or AST at least 3 times the upper limit of normal, more often than with placebo or a non-hepatotoxic control; total bilirubin above 2 times the upper limit of normal in some of those subjects, without initial signs of cholestasis (raised alkaline phosphatase); and no other explanation, such as viral hepatitis, pre-existing liver disease or another hepatotoxic drug.
FDA states that such cases identify a drug likely to cause severe injury, fatal or requiring transplant, at a rate of at least one tenth the rate of Hy's law cases. One case in a clinical database is worrisome; two are considered highly predictive. Finding none does not show that a drug with aminotransferase rises is free of risk.
Show data: DILIrank 2.0 categories
| Category | Drugs | Causal relationship with liver injury |
|---|---|---|
| vMost-DILI-concern | 217 | Established |
| vLess-DILI-concern | 351 | Established |
| vNo-DILI-concern | 414 | Established |
| Ambiguous-DILI-concern | 354 | Undetermined |
| Total | 1,336 | 1,036 in version 1.0 plus 300 drugs approved 2010–2021 |
FDA DILIrank dataset page. Classes come from the hepatotoxicity descriptions in FDA-approved labeling combined with causality evidence from the literature. The list covers FDA-approved drugs only.
Compartmental, PBPK and toxicokinetic models predict concentrations; they do not predict harm by themselves
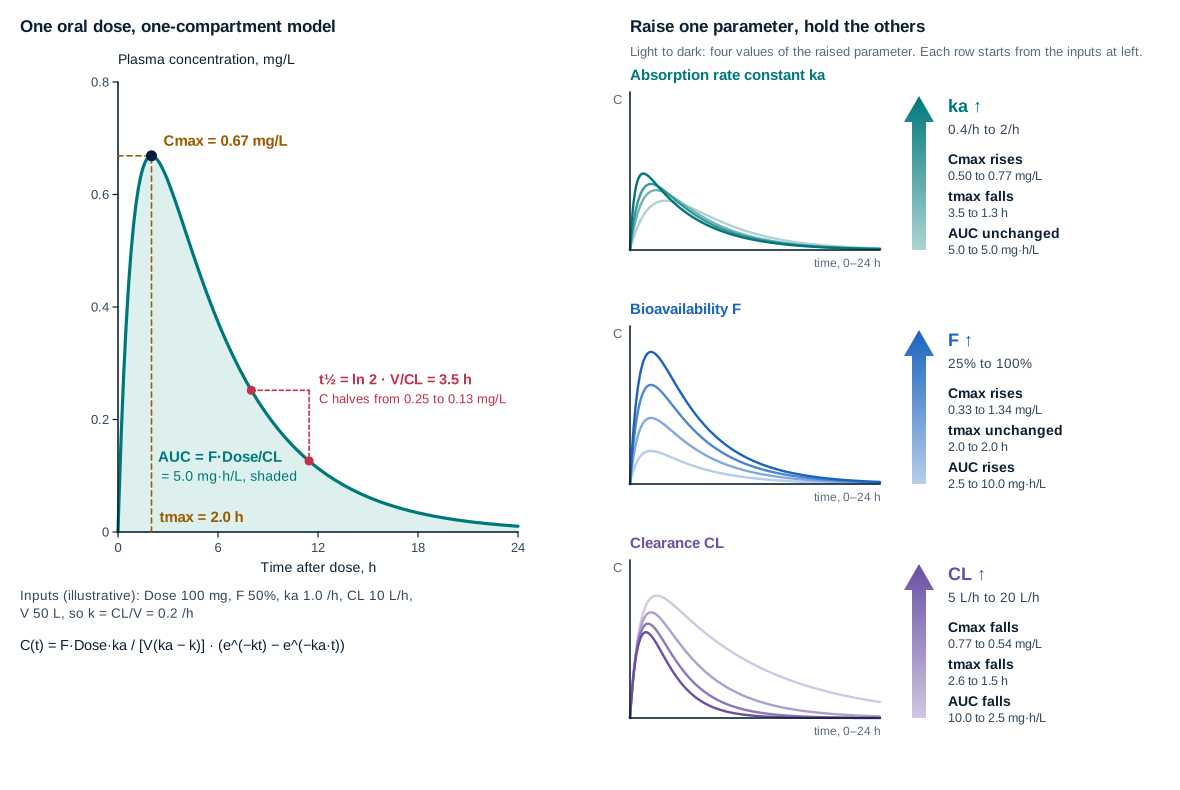
The one-compartment equations, the Hill model and the organ-and-blood-flow structure of a PBPK model are on ADME, PK and PBPK. This section covers how regulators treat PBPK, the main platforms, and a toxicokinetic package developed at US EPA for screening chemicals.
| Regulator and document | Status | What it says about acceptance |
|---|---|---|
| FDA, Physiologically Based Pharmacokinetic Analyses — Format and Content | Final guidance, CDER; the PDF cover is dated August 2018 (page footer 09/03/18), and FDA's guidance page lists the issue date as September 2018 | PBPK predictions can inform “whether, when, and how to conduct certain clinical pharmacology studies” and support labeling dose recommendations. Accepting them in place of clinical data is decided “on a case-by-case basis.” The guidance “does not address methodological considerations and best practices.” |
| EMA, Guideline on the reporting of PBPK modelling and simulation (EMA/CHMP/458101/2016) | Final, adopted December 13, 2018; in effect July 1, 2019 | The platform must be qualified for its intended use, and “qualification is purpose and platform version specific.” Requirements rise with regulatory impact (high, moderate, low): using a model to waive an interaction study, or to set a child's dose with little or no clinical exposure data, is high impact. Applies to commercial and in-house platforms. |
FDA guidance PDF and FDA guidance page (docket FDA-2016-D-3969); EMA guideline PDF, sections on qualification and regulatory impact. Status as of October 2026.
| Platform | Maintainer | What the peer-reviewed description says | License |
|---|---|---|---|
| Simcyp Simulator | Certara (Sheffield, UK) | A population-based “bottom-up” simulator combining in vitro enzyme and transporter data and physicochemistry with demographic, physiological and genetic data on healthy and disease populations; built for multi-drug interactions, metabolite profiles and time-dependent effects such as auto-induction | Commercial |
| GastroPlus | Simulations Plus (Lancaster, California) | Absorption by the advanced compartmental absorption and transit (ACAT) model, nine compartments for gut segments, linked to a PBPK model of fourteen tissue compartments. Agoram and colleagues describe ACAT as differential equations for release, dissolution, passive and carrier-mediated absorption, saturable metabolism and efflux, predicting fraction absorbed, bioavailability and plasma profiles | Commercial |
| PK-Sim and MoBi (Open Systems Pharmacology suite) | Open Systems Pharmacology community, developed on GitHub | Formerly commercial; released as open source from version 7.0 in early 2017. Covers PBPK across preclinical species and humans, drug interactions and special populations, with published qualification repositories | Open source, GPLv2 |
Jamei M, et al. Expert Opin Drug Metab Toxicol 2009;5:211–223 (Simcyp); Agoram B, Woltosz WS, Bolger MB. Adv Drug Deliv Rev 2001;50 Suppl 1:S41–S67 (ACAT); Lippert J, et al. CPT Pharmacometrics Syst Pharmacol 2019;8:878–882 (Open Systems Pharmacology). Maintainers as named in the methods of Choules MP, et al. J Clin Pharmacol 2025;65:1096–1105 (Simcyp, Certara) and Wang L, et al. Clin Transl Sci 2026;19:e70715 (GastroPlus version 9.9, Simulations Plus; ACAT and tissue compartments).
Physiologically based toxicokinetics for thousands of chemicals: US EPA httk
The httk authors note that “pharmacokinetic” and “toxicokinetic” are used largely interchangeably, and chose “toxicokinetic” because the package gives dose context to toxicity screening. The httk R package, written by scientists at US EPA and the National Toxicology Program (NIEHS), pairs generic models with two in vitro measurements per chemical: intrinsic hepatic clearance in primary hepatocytes (Clint) and the fraction unbound in plasma (fub). Run in reverse (“reverse dosimetry”), it estimates the exposure dose that would produce a concentration found active in high-throughput screens.
| Item | Detail |
|---|---|
| Models (2017 paper) | pbtk (physiologically based), 3compartment, 3compartmentss (steady state) and 1compartment |
| Steady-state equation (3compartmentss) | Css = kdose / [fub·Qgfr + (Qliver + Qgut)·fub·Clmetabolism / ((Qliver + Qgut) + fub·Clmetabolism/Rblood2plasma)]: renal filtration plus well-stirred liver clearance, for a constant dose rate kdose (mg/kg body weight per day) |
| Coverage at publication | 553 chemicals with human in vitro data, including 94 pharmaceuticals and 415 ToxCast chemicals; rat in vitro data for 67 |
| Assumptions | Perfusion-limited tissues; fraction absorbed set to 1 when no measured value exists; renal elimination by passive glomerular filtration |
| Limits stated by the authors | Full kinetics may need data not available from high-throughput in vitro work: bioavailability, transporters, protein-binding kinetics, and extra-hepatic or strongly saturable metabolism |
| Current release | Version 2.7.4 on CRAN (December 2025), MIT license; includes a Monte Carlo sampler for human variability and empirically calibrated methods for tissue partition coefficients |
Pearce RG, Setzer RW, Strope CL, Sipes NS, Wambaugh JF. httk: R Package for High-Throughput Toxicokinetics. J Stat Softw 2017;79(4):1–26 (sections 2.1–2.3); CRAN package description, httk 2.7.4, published December 9, 2025. Author affiliations: U.S. Environmental Protection Agency and the National Toxicology Program, NIEHS.
Population models split variability into a typical value, differences between people and measurement error
A nonlinear mixed-effects model fits everyone's data at once. Fixed effects (θ) give the typical parameter values; random effects (η) give each person's deviation; a residual term (ε) absorbs assay noise and model misfit. FDA's 2022 guidance notes that population PK analysis is frequently used to guide drug development and to inform individualized dosing.
| Level | Equation | Meaning |
|---|---|---|
| Individual parameter | CLi = θ1 · exp(η1i) | θ1 is the population clearance; η1i is subject i's deviation, normally distributed with mean 0 and variance ω², so CLi is log-normal |
| Between-subject CV | CV (%) = √(exp(ω²) − 1) · 100% | Converts the log-scale variance ω² to a coefficient of variation |
| Additive residual error | Y = f(θ, time) + ε | Constant noise; often enough for pharmacodynamic data |
| Proportional | Y = f(θ, time) · (1 + ε) | Noise scales with the prediction |
| Exponential | Y = f(θ, time) · exp(ε) | Tends to overweight low concentrations, like the proportional form |
| Combined | Y = f(θ, time) · (1 + ε1) + ε2 | Often used for dense PK data because it reflects assay variability |
Mould DR, Upton RN. CPT Pharmacometrics Syst Pharmacol 2012;1:e6 (fixed and random effects, two levels of unexplained variability); 2013;2:e38, equations 5–6 and Table 1; U.S. FDA, Population Pharmacokinetics, Guidance for Industry, February 2022 (final; CDER and CBER).
| Software | Maintainer and license | Estimation methods |
|---|---|---|
| NONMEM | ICON (Dublin); commercial. The first population PK software, developed in San Francisco in 1978; requires a Fortran compiler | First-order conditional estimation (FOCE; with interaction, FOCEI, in the caffeine study below), Laplace, iterative two-stage, importance sampling, SAEM and Bayesian Markov-chain Monte Carlo, as listed by ICON |
| Monolix | Lixoft (Paris) in 2019; current documentation published by Simulations Plus; commercial | Stochastic approximation expectation-maximization (SAEM) |
| nlmixr2 | Open-source R package (GPL ≥ 3); version 7.0.1 on CRAN, August 2026 | SAEM, FOCE and FOCEI, nlme; differential equations solved by the rxode2 package |
Mould and Upton 2013: FOCE and Laplace approximate the likelihood with a simpler function, SAEM refines estimates stochastically, and only the original FO method is “of concern” because it can bias random-effect estimates. Fidler M, et al. CPT Pharmacometrics Syst Pharmacol 2019;8:621–633 (software, licenses and nlmixr estimation methods); Mould DR, Upton RN 2012 (NONMEM was the first population PK software and requires Fortran); ICON, NONMEM product page (estimation methods; written in ANSI Fortran 95), retrieved October 2026; Schoemaker R, et al. CPT Pharmacometrics Syst Pharmacol 2019;8:923–930 (nlmixr SAEM and FOCEI matched Monolix/SAEM and NONMEM/FOCEI closely); CRAN, nlmixr2 and nlmixr2est package descriptions, retrieved October 2026.
A worked simulation: caffeine in 1,000 virtual adults
Csajka and colleagues at the University of California, San Francisco, fitted caffeine data from 24 healthy adults (8 given an herbal product containing caffeine and ephedrine, 16 given pharmaceutical caffeine, ephedrine or both) with a one-compartment model in NONMEM (FOCE with interaction). The simulation below draws 1,000 virtual adults from their published estimates.
The median curve is the typical person; the band is the spread that clearance, volume and absorption differences alone produce, before any measurement error.
Show data, method and limits
| Time after dose, h | 5th percentile | Median | 95th percentile | Typical individual (η = 0) |
|---|---|---|---|---|
| 0.5 | 0.86 | 1.77 | 3.39 | 1.77 |
| 1 | 2.54 | 3.79 | 5.26 | 3.91 |
| 2 | 2.78 | 3.71 | 4.88 | 3.79 |
| 4 | 1.97 | 2.88 | 3.86 | 2.94 |
| 8 | 0.70 | 1.73 | 2.72 | 1.75 |
| 12 | 0.25 | 1.04 | 1.99 | 1.05 |
| 24 | 0.01 | 0.23 | 0.91 | 0.22 |
Simulated peak concentration: 5th percentile 2.93, median 3.98, 95th percentile 5.35 mg/L; time of peak 0.8, 1.3 and 2.0 h. Exposure AUC0–∞ = D/(CL/F): 18.6, 35.2 and 65.6 mg·h/L. Typical half-life ln 2·V/CL = 5.37 h, against 5.3 h in the authors' Results (5.4 h in their Discussion).
- Published parameters used
- CL/F 0.083 L/min (4.98 L/h), between-subject CV 38%; V/F 38.6 L, CV 20%; ka 0.064 /min (3.84 /h), CV 50%; lag time 22.2 min, estimated for the herbal product only (no lag with pharmaceutical caffeine), with no between-subject variability reported. The authors report CL/F falling to 0.038 L/min in oral-contraceptive users; that subgroup is not simulated.
- Dose
- 175 mg, the measured caffeine content of the herbal-product dose in the study (labeled 200 mg). The model is linear, so concentrations scale with dose.
- Variability model
- Csajka and colleagues model each caffeine parameter exponentially, Pj = θ·eηj, with independent, normally distributed η of mean zero (their “Variance models” section), so the log-normal form and the independent draws follow the paper. The paper reports the variability only as CV%; converting CV to ω with ω² = ln(1 + CV²), from equation 6 of Mould and Upton (2013), is this page's assumption: ω = 0.367 (CL), 0.198 (V), 0.472 (ka).
- Not included
- Residual error (the authors used a proportional error model; Table 3 does not report its value for caffeine), pre-dose caffeine, oral-contraceptive use, smoking and any other covariate. Because CL and V are apparent values (divided by bioavailability F), F is not needed.
- What it does not establish
- It describes neither any product nor any safe or effective amount of caffeine. It reproduces the spread implied by one published model fitted to 24 people.
Csajka et al. 2005 (study 1: herbal product; study 2: pharmaceutical caffeine, alone or with ephedrine); Mould and Upton 2013. See Caffeine and Ephedra.
DILIsym links liver exposure to three injury mechanisms and simulates enzyme rises across virtual populations
DILIsym is a mathematical model of drug-induced liver injury, developed over about a decade through a public–private partnership. It combines a compound's measured potency for oxidative stress, mitochondrial dysfunction and disruption of bile-acid handling with an estimate of liver exposure, for example from a PBPK model.
| Item | As described in peer-reviewed papers |
|---|---|
| Inputs | In vitro assays in human systems: reactive oxygen species production, cellular oxygen consumption (mitochondrial respiration), and inhibition constants for bile-acid transporters such as BSEP, NTCP and MRP3/4; plus PBPK estimates of liver exposure to parent compound and metabolites |
| Outputs | Simulated serum ALT and bilirubin, the fraction of a simulated population (SimPops) above 3 times the upper limit of normal, simulated Hy's law cases, and which mechanism dominates |
| Published examples | Tolcapone at 200 mg three times daily for one week: ALT above 3 times the upper limit in 2.2% of a simulated population, against none for entacapone, attributed mainly to mitochondrial uncoupling potency and liver exposure. Fezolinetant (version 7A): no ALT above 3 times the upper limit in simulated healthy volunteers at therapeutic doses; one simulated Hy's law case at 45 and 60 mg once daily in a population with fatty liver disease and weaker mitochondria |
| Maintainer | Commercial. Authors' affiliation: DILIsym Services in 2016; Simulations Plus (Research Triangle Park, North Carolina) in 2026 |
| Regulatory use | Its developers report that results are increasingly included in regulatory communications and new drug application submissions. No FDA or EMA document stating acceptance criteria for it was found for this page |
| Limits stated in the papers | Only mechanisms with in vitro data can be represented (tolcapone: respiration and bile-acid transport only, so oxidative stress was not assessed); no virtual population matched the fezolinetant trial population, and model risk features could not be tied to age, sex or weight |
Watkins PB. Methods Mol Biol 2022;2486:181–196; Longo DM, et al. CPT Pharmacometrics Syst Pharmacol 2016;5:31–39; Nielsen JC, et al. Clin Pharmacol Ther 2026;119:1016–1024; Shoda LKM, et al. Biopharm Drug Dispos 2014;35:33–49. All are co-authored by the model's developers, which readers should weigh.
Structure, analogues and in vitro screens can flag a hazard, each only inside its stated domain
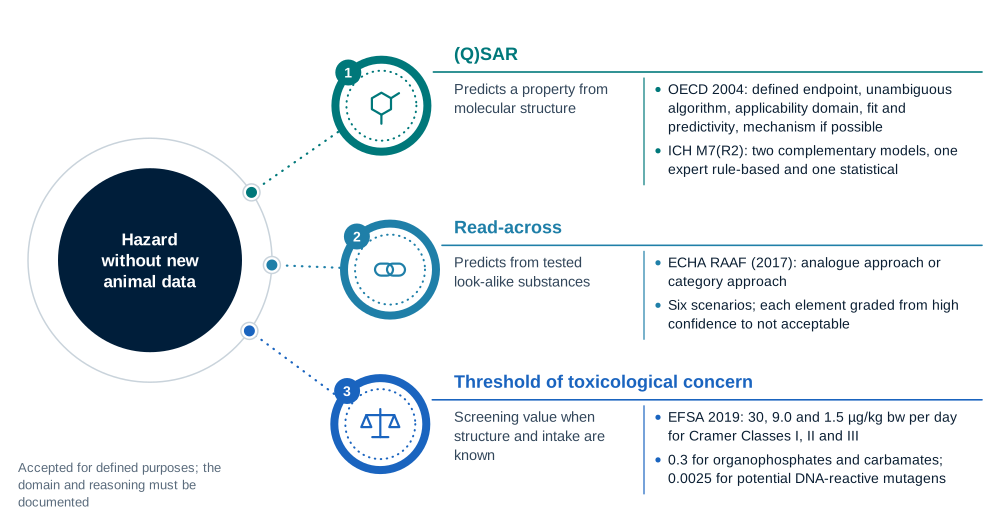
These methods estimate a property of a chemical from its structure, from tested look-alikes, or from cell and protein assays. Regulators accept them for defined purposes and ask that the domain and the reasoning be documented.
(Q)SAR models and the OECD QSAR Toolbox
A (quantitative) structure–activity relationship predicts a property from molecular structure. In November 2004 OECD member countries agreed that, for regulatory consideration, a (Q)SAR model should have:
- a defined endpoint;
- an unambiguous algorithm;
- a defined domain of applicability;
- appropriate measures of goodness-of-fit, robustness and predictivity;
- a mechanistic interpretation, if possible.
ICH M7(R2) applies this to mutagenic impurities in medicines: two complementary (Q)SAR methods, one expert rule-based and one statistical, both following the OECD principles. If neither finds a structural alert, the impurity is considered of no mutagenic concern. The OECD QSAR Toolbox is free software, with OECD and ECHA named as copyright holders, that retrieves experimental data, simulates metabolism and groups chemicals for read-across.
OECD Principles for the Validation, for Regulatory Purposes, of (Q)SAR Models (37th Joint Meeting, November 2004), with notes that (Q)SARs are reductionist, that unpublished commercial algorithms hinder independent assessment, and that lack of a mechanistic interpretation does not by itself rule out regulatory use; ICH M7(R2), Step 4, April 3, 2023, section 6; OECD QSAR Toolbox website (version 4.9 available), retrieved October 2026.
Read-across, as ECHA assesses it
Read-across predicts a property of a target substance from tested source substances. ECHA's Read-Across Assessment Framework (RAAF, March 2017) separates an analogue approach (one or a few sources, no trend) from a category approach (a group with a regular pattern or a worst case). Its six scenarios rest on two hypotheses: the substances are transformed to the same compound, or different compounds cause the same type of effect.
Each assessment element, from structural similarity and exposure of the biological target to impurities and bias that influences the prediction, is graded from “acceptable with high confidence” to “not acceptable.” ECHA calls the RAAF a framework for expert judgment, “rather than a series of steps to be followed mechanically,” and states that it is not legal advice.
ECHA, Read-Across Assessment Framework (RAAF), ECHA-17-R-01-EN, March 2017.
Threshold of toxicological concern
When a structure is known, toxicity data are limited and intake can be estimated, EFSA's 2019 guidance, built on a joint EFSA and WHO review, sets screening values: 30, 9.0 and 1.5 µg/kg body weight per day for Cramer Classes I, II and III; 0.3 for organophosphates and carbamates; 0.0025 for potential DNA-reactive mutagens or carcinogens. The full table and exclusions are on Margin of exposure and TTC and in the course section When there are no data.
EFSA Scientific Committee. Guidance on the use of the Threshold of Toxicological Concern approach in food safety assessment. EFSA J 2019;17(6):5708, abstract, section 1 and Table 2.
High-throughput screening and adverse outcome pathways
| Program | What it is | Who runs it | Stated use |
|---|---|---|---|
| ToxCast | Medium- and high-throughput in vitro assays of how chemicals act on biological targets, covering almost 10,000 substances from more than 20 assay sources; curve-fitted with open-source R packages (tcpl, tcplfit2) and public through the CompTox Chemicals Dashboard | US EPA | Ranking and prioritizing chemicals for further evaluation; EPA's Endocrine Disruptor Screening Program is working to use it to identify priority chemicals |
| Tox21 | A federal collaboration to develop faster toxicity screening methods; ToxCast aggregates its data | US EPA, NCATS, NIEHS and FDA | Screening chemicals for potential to disrupt processes in the human body |
| Adverse outcome pathway (AOP) | A documented chain from a molecular initiating event, through measurable key events, to an adverse outcome of regulatory significance. An AOP should not be specific to one stressor | OECD program; AOPs are developed in the AOP-Wiki, part of the AOP Knowledge Base | Organizing mechanistic evidence; endorsed AOPs are published in the OECD Series on Adverse Outcome Pathways |
US EPA, Toxicity Forecasting (ToxCast) page, updated August 27, 2026; US EPA, Toxicology Testing in the 21st Century (Tox21) page, updated April 22, 2026; Thomas RS, et al. Toxicol Sci 2019;169:317–332 (goal of broader acceptance of these methods for higher-tier regulatory decisions); OECD AOP Developers' Handbook version 2.5, July 2022; Ankley GT, et al. Environ Toxicol Chem 2010;29:730–741 (the AOP concept).
Benchmark-dose software fits the whole dose–response curve; the method is taught on two other pages
How a benchmark dose and its lower bound (BMDL) are derived, and how they compare with a NOAEL, are explained with calculators in the course section NOAEL or benchmark dose and in Dose–response and the margin. The definitions are on Dose–response vocabulary.
| Tool or document | Maintainer and status | What it states |
|---|---|---|
| Benchmark Dose Software (BMDS) | US EPA; BMDS Online, BMDS Desktop and the pybmds Python package (version 25.2 highlighted, page updated September 21, 2026) | Models for dichotomous, continuous and nested data; “used by EPA risk assessors primarily for chemical risk assessment” |
| EFSA, Guidance on the use of the benchmark dose approach in risk assessment | EFSA Scientific Committee; Final, EFSA J 2022;20(10):7584 | The BMD approach is “scientifically more advanced” than the NOAEL approach; recommends a Bayesian paradigm with model averaging as the preferred method; the BMDL is the potential reference point and the BMDU/BMDL ratio expresses uncertainty |
US EPA, Benchmark Dose Software page; EFSA Scientific Committee 2022, abstract.
USEtox compares the toxic impact of chemical emissions in life-cycle assessment; it does not assess the safety of swallowing a supplement
USEtox is the scientific consensus model developed under the UNEP–SETAC Life Cycle Initiative to characterize the human toxicity and freshwater ecotoxicity of chemical emissions in life-cycle impact assessment. It answers how much toxic impact one kilogram released to air, water or soil causes, relative to other chemicals. Life-cycle assessment itself is covered on Sustainability and LCA.
Explanation, details and sources
The model came from a comparison of seven existing models (CalTOX, IMPACT 2002, USES-LCA, BETR, EDIP, WATSON and EcoSense) on 45 organic chemicals. Harmonizing their most influential elements cut the spread between models from up to 13 orders of magnitude to no more than two for any substance.
Human effect factors start from the ED50, the lifetime dose that raises disease probability by 50%, with a default linear slope; for cancer most ED50 values are derived from TD50 values in the Carcinogenic Potency Database. Characterization factors are not normalized to a reference substance. Rosenbaum and colleagues (2011) report that their comparison of carcinogenic potency by inhalation and by mouth “suggests that results by one route can reasonably be used to represent another route.”
The model works at indoor, urban, continental and global scales, with rural air, agricultural and natural soil, freshwater and coastal marine compartments. Its team asks that interim factors (called “indicative” in the 2.0 documentation) always be used together with recommended ones, because leaving them out would score those substances as having zero impact; results dominated by interim factors carry lower confidence, and a sensitivity check can rerun them with recommended factors only. The current manual adds interfaces for product applications, such as personal care products and food contact materials, and describes its outputs as relative measures for screening, alternatives assessment and life-cycle assessment.
A CTUh value says how one emission compares with another in a life-cycle inventory. It is not a reference dose, a margin of exposure or a judgment that an ingested product is safe; those come from the methods in the sections above.
Rosenbaum RK, et al. Int J Life Cycle Assess 2008;13:532–546 (abstract); Rosenbaum RK, et al. Int J Life Cycle Assess 2011;16:710–727 (abstract); usetox.org model page and USEtox manual, retrieved October 2026; Fantke P (ed.), USEtox 2.0 Documentation (2017), sections 2.2, 3.1 and 8 (characterization factors and units, interim and recommended factors, human effect factors and the CPDB).
Fluid-dynamics models of the stomach and airways explain flow patterns, but their validation is partial
Computational fluid dynamics (CFD) solves the equations of mass and momentum conservation on a 3-D geometry. For an incompressible Newtonian liquid in laminar flow, as in the stomach model below: ∇·u = 0 and ρ(∂u/∂t + u·∇u) = −∇p + μ∇²u, where u is velocity, p pressure, ρ density and μ viscosity (the Navier–Stokes equations).
| Application | What was modeled | Validation and stated limits |
|---|---|---|
| Gastric mixing (Ferrua and Singh 2010) | An average-sized human stomach with antral contraction waves of up to 80% occlusion, solved in Fluent for contents of 10−3 Pa·s (water-like) and 1 Pa·s (honey-like). At high viscosity the retropulsive jet and eddies weakened and pressure rose, suggesting viscous meals mix poorly | Reported as in good agreement with earlier experimental data. Upper-wall contractions were “to some extent, arbitrarily defined” for lack of measurements; wall roughness and the mucus layer were not modeled |
| Aerosol deposition (Longest and Holbrook 2012, review) | Transport and deposition of inhaled pharmaceutical aerosols in the inhaler, nose and mouth, conducting airways and alveoli | The review concludes that more refined model validations are needed, together with concurrent experiments |
Ferrua MJ, Singh RP. J Food Sci 2010;75:R151–R162; Longest PW, Holbrook LT. Adv Drug Deliv Rev 2012;64:296–311. For medical devices, FDA's final guidance Assessing the Credibility of Computational Modeling and Simulation in Medical Device Submissions (CDRH, November 2023) sets a risk-informed credibility framework for physics-based models.
Related pages: ADME, PK and PBPK · Toxicology and risk assessment · Toxicology and exposure assessment · Academy: toxicology and dose · Green tea · Caffeine
Health information notice
These statements have not been evaluated by the Food and Drug Administration. Nothing on this site is intended to diagnose, treat, cure or prevent any disease. The information is for general education only. It is not medical advice and does not replace advice, diagnosis or treatment from a qualified health professional, or any medication a clinician has prescribed.
Do not start, stop or change any medicine, supplement or herbal product because of something you read here. Talk to your doctor or pharmacist first, especially if you are pregnant or breastfeeding, have a medical condition, take any medicines, are preparing for surgery, or are caring for a child. Research findings, traditional uses and safety data are reported as their sources state them; they are not recommendations or claims about any product. If you think you may have a medical emergency, call your doctor or 911 at once.
EUTECNIQ Sciences sells no supplements or health products today and receives nothing from any product or ingredient mentioned on this site; any commercial interest it later has in an ingredient will be stated on that ingredient’s page.