

Platform · the difference
Not another laboratory. A scientific AI company for botanical ingredients.
EUTECNIQ is building the Large Botanical Model: one chain of physics-informed models, from finding the plant to bringing an ingredient to market. Its first use is regulatory and development work for clients; ingredients EUTECNIQ designs in their final format, and owns, follow once the models are validated. Development and testing services are one revenue line, not the business.
ProposedNo laboratory, trained model, owned ingredient or product exists yet. The computed studies shown here are real calculations on published data or on an illustrative simulator, labeled as such.
01 · The business
A contract lab sells hours. EUTECNIQ would own the ingredients it designs.
A fee-for-service laboratory or contract developer is usually paid per test, study or batch, and the client keeps the result. EUTECNIQ proposes a loop instead: its models design an ingredient in its final format, EUTECNIQ uses that ingredient in its own products and licenses it, and every lot and every sale adds data that makes the next design better.

- 1 Models and data
- 2 Ingredients designed in final format
- 3 Owned products and licenses
- 4 Market, lot and outcome data
- 5 Development and testing services: early revenue and data
The proposed business model, rendered by EUTECNIQ. No product, license or revenue exists yet.
| Typical contract R&D or testing lab | EUTECNIQ (proposed) | |
|---|---|---|
| What it sells | Tests, studies, batches and reports | Owned ingredients in final format, its own products, licenses; services as an early revenue line |
| Who keeps the result | The client | EUTECNIQ, for work on its own account; the client, under contract, for client work |
| How the next experiment is chosen | By the client’s protocol, often one factor or one design at a time | By models: optimization chooses which experiments carry the most information |
| Scope | One step of the chain | Plant to market, in one record and one model chain |
| What compounds over time | Experience | Lot-linked data and models it owns, where contracts allow |
EUTECNIQ’s characterization of a common business model; many laboratories offer more than one service, and EUTECNIQ does not claim to be the only company combining these steps. Named companies are compared from their own documents on How EUTECNIQ differs.
02 · One model chain
Six layers of models, one data record, plant to market.
Each layer passes its predictions, with their uncertainty, to the next. A solubility predicted at the molecule layer sets the solvent options the process optimizer may use; the process result sets what the formulation layer starts from; the exposure model judges the final format.

- 1 Discover: Large botanical data model: plants, compounds, targets
- 2 Molecule: Quantum chemistry, COSMO-SAC / COSMO-RS solubility
- 3 Process: MINLP superstructure, multi-objective optimization
- 4 Formulate: Final-format design: delivery system and dosage form together
- 5 Exposure: PBPK/PD with Bayesian calibration
- 6 Market: Owned ingredients, own products, licenses
The proposed model chain, rendered by EUTECNIQ. The computed studies on this site cover parts of layers 2 to 5; no model has been trained on EUTECNIQ data, which do not yet exist.
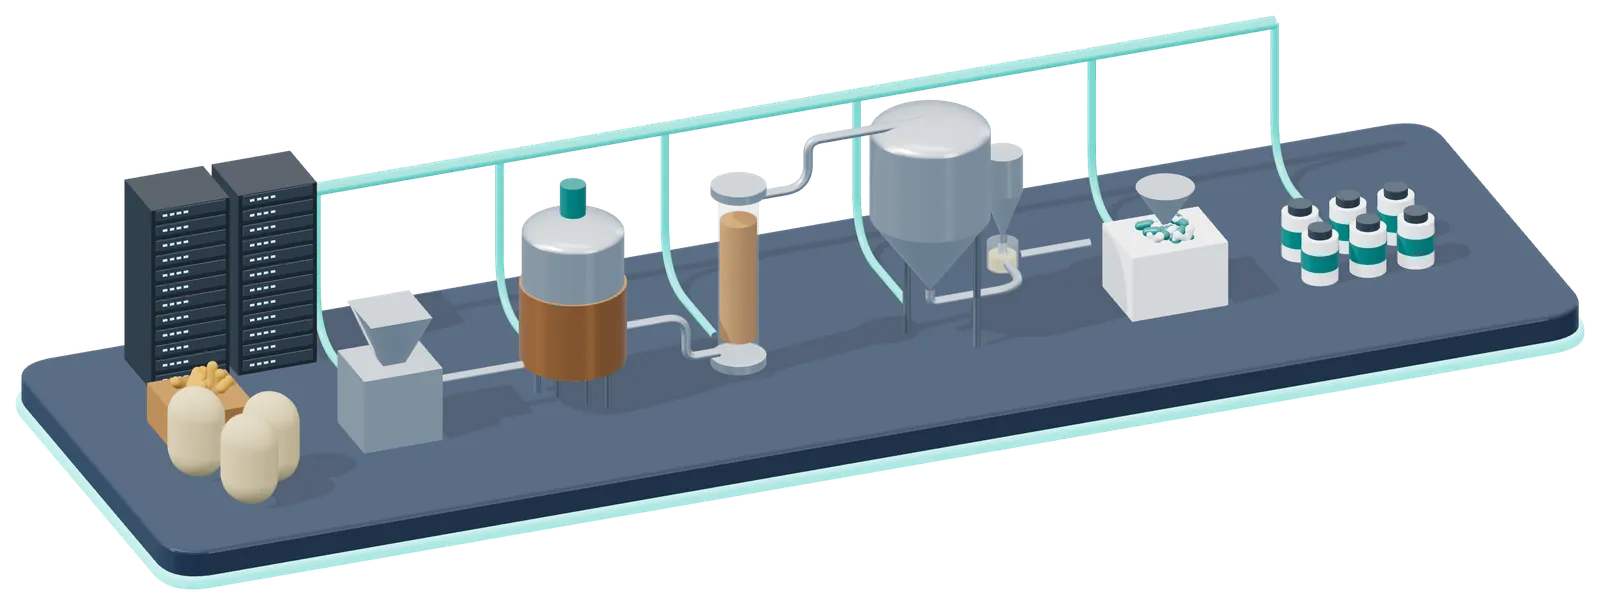
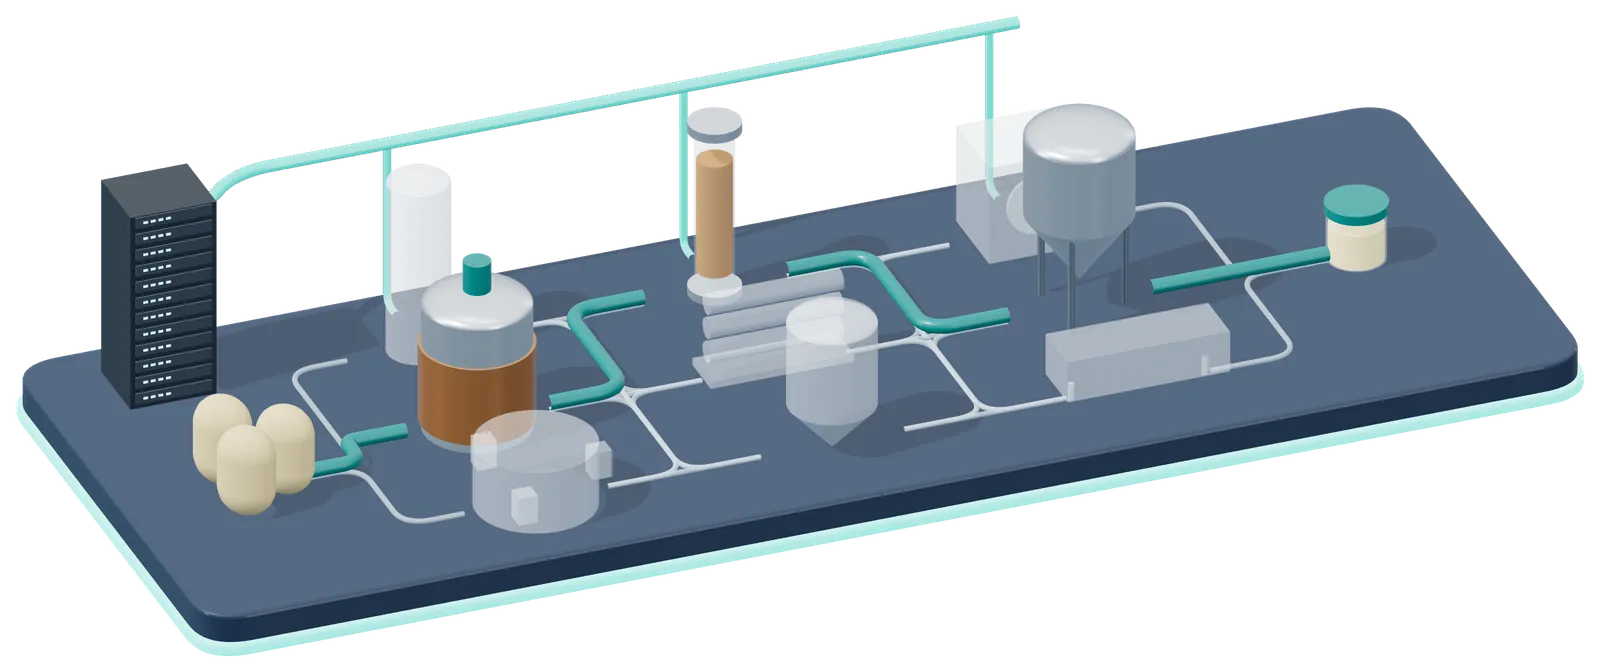
- 1 Authenticated plant material
- 2 Mill: particle size set by the model
- 3 Extraction: route and conditions chosen by optimization
- 4 Purification and standardization
- 5 Drying into the final-format particle
- 6 Final dosage form
- 7 Finished product
- 8 Model and data server: one record and one model chain for every station
The proposed integrated line, rendered by EUTECNIQ from generic equipment types; schematic, not to scale. EUTECNIQ has no facility or equipment yet.
- Discover. A large botanical data model adapted from open models and trained on authenticated lot records. Large botanical model
- Molecule. Conformers, quantum chemistry and COSMO-SAC / COSMO-RS solvent screening. Quantum chemistry
- Process. Mixed-integer nonlinear programming (MINLP) and multi-objective optimization of the whole route. Design-space optimization
- Formulate. The delivery system and the dosage form designed together with the ingredient. Delivery
- Exposure. Mechanistic PK, PBPK and PD, calibrated by Bayesian inference on human data. Computational research
- Market. Owned ingredients, products and licenses, with outcome data returned to the models. Investor overview
03 · Molecules first
Start from the molecule’s surface, not from trial and error.
Whether a compound dissolves, crosses a membrane or survives drying depends on how charge is spread over its surface. EUTECNIQ has already computed conformers for curcumin, quercetin and berberine and screened 13 molecules against solvents with COSMO-SAC, which predicts solubility from that surface charge.
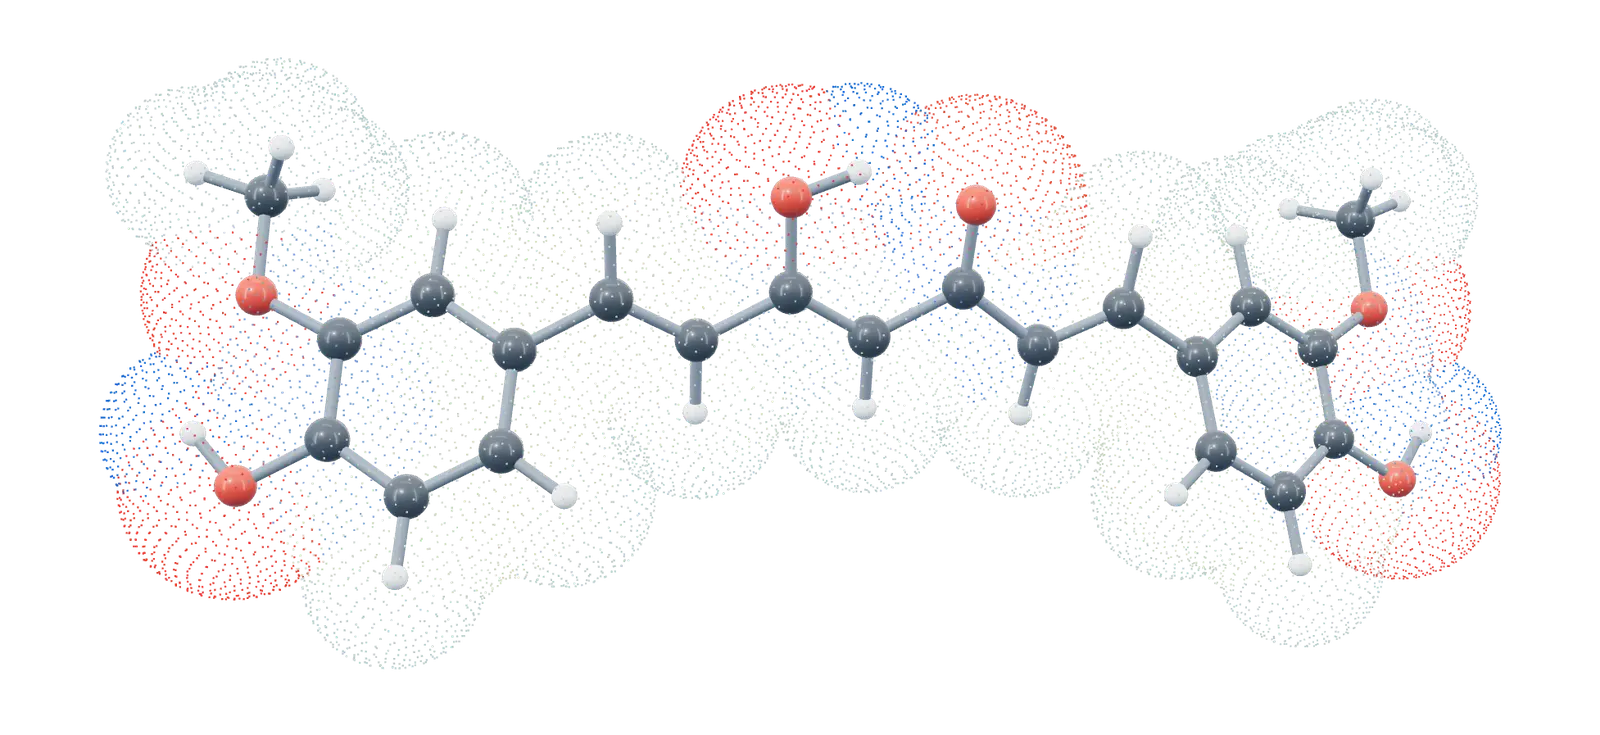
- 1 Negative surface around oxygens: hydrogen-bond acceptor
- 2 Positive surface on hydroxyl hydrogens: donor
- 3 Neutral, nonpolar ring surface
Curcumin, keto–enol form: lowest-energy MMFF94 conformer of 60 (RDKit, from PubChem CID 969516). Surface dots colored by the Gasteiger partial charge of the nearest atom, a quick proxy. The COSMO σ-surfaces on the quantum chemistry page come from quantum-chemical calculations.
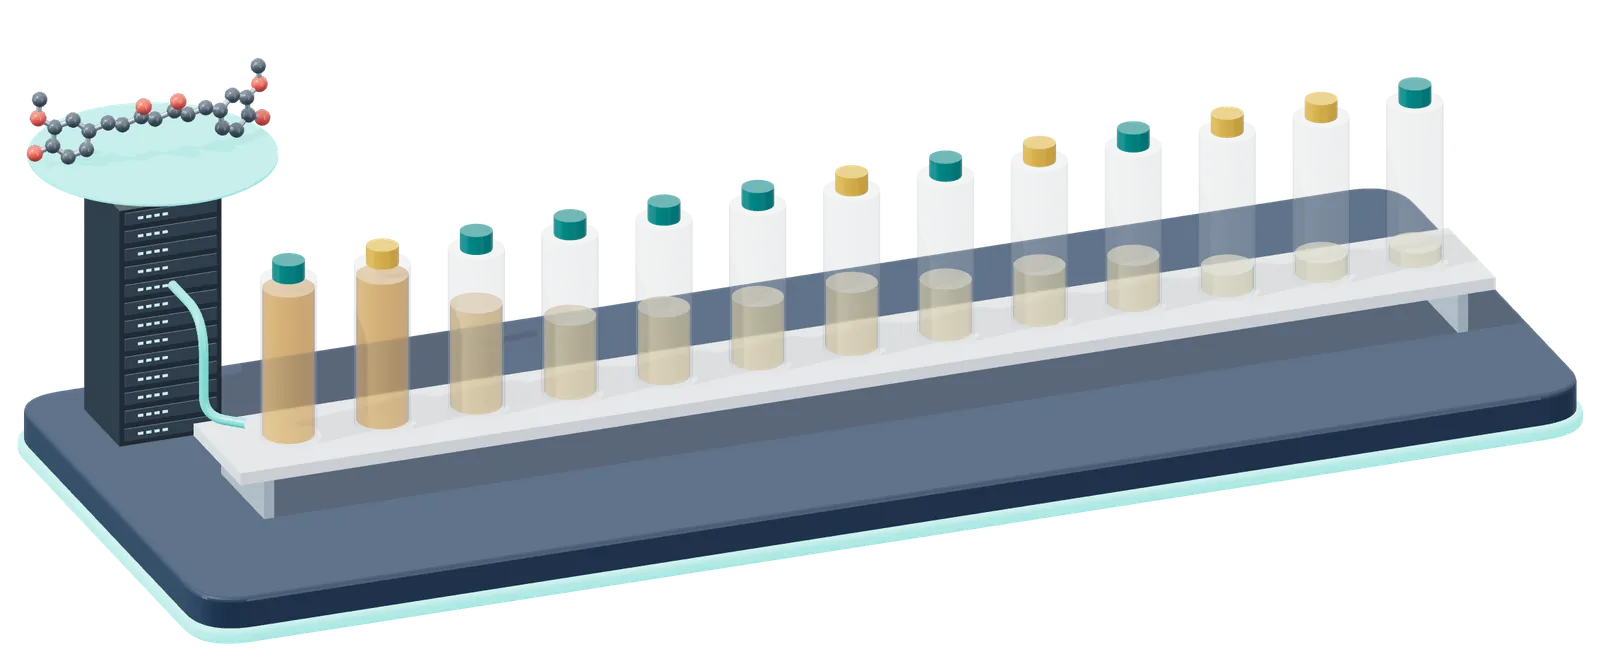
- 1 Computed molecule: curcumin, keto–enol form
- 2 Fill height: log of curcumin solubility, g per kg solvent at 25 °C
- 3 Cap color: ICH Q3C class 2 (amber) or 3 (teal)
Data: FIG 015. Measured curcumin solubility interpolated to 25 °C, g per kg solvent (BigSolDB 2.0: Cui et al., J Mol Liq 2021; Shen et al., J Chem Thermodyn 2019; Fluid Phase Equilib 2021). Fill height is logarithmic. Classes from ICH Q3C(R8), which applies to medicines; supplements follow other rules. These are the measurements a COSMO screen is tested against.Values shown: DMSO 1,465; THF 1,327; acetone 105; n-propanol 22; isopropanol 16; ethyl acetate 12; acetonitrile 12; ethanol 6.1; methanol 5.9; n-butanol 4.4; m-xylene 1.1; n-hexane 0.9; n-heptane 0.7.
Molecular dynamics goes a step further: it simulates the oil, the emulsifier, water and the ingredient atom by atom, so candidate oils, surfactants and carriers for a lipophilic ingredient can be compared before the first experiment, for example by how well the ingredient dissolves in each oil and where it sits at the interface. Molecular simulation is already used in pharmaceutics to predict solubility, solubilization and partitioning (Hossain et al., 2019). Machine-learned force fields, trained on quantum-chemistry energies and forces, aim to bring near-quantum accuracy to these simulations at a small fraction of the cost of the quantum calculations they learned from.
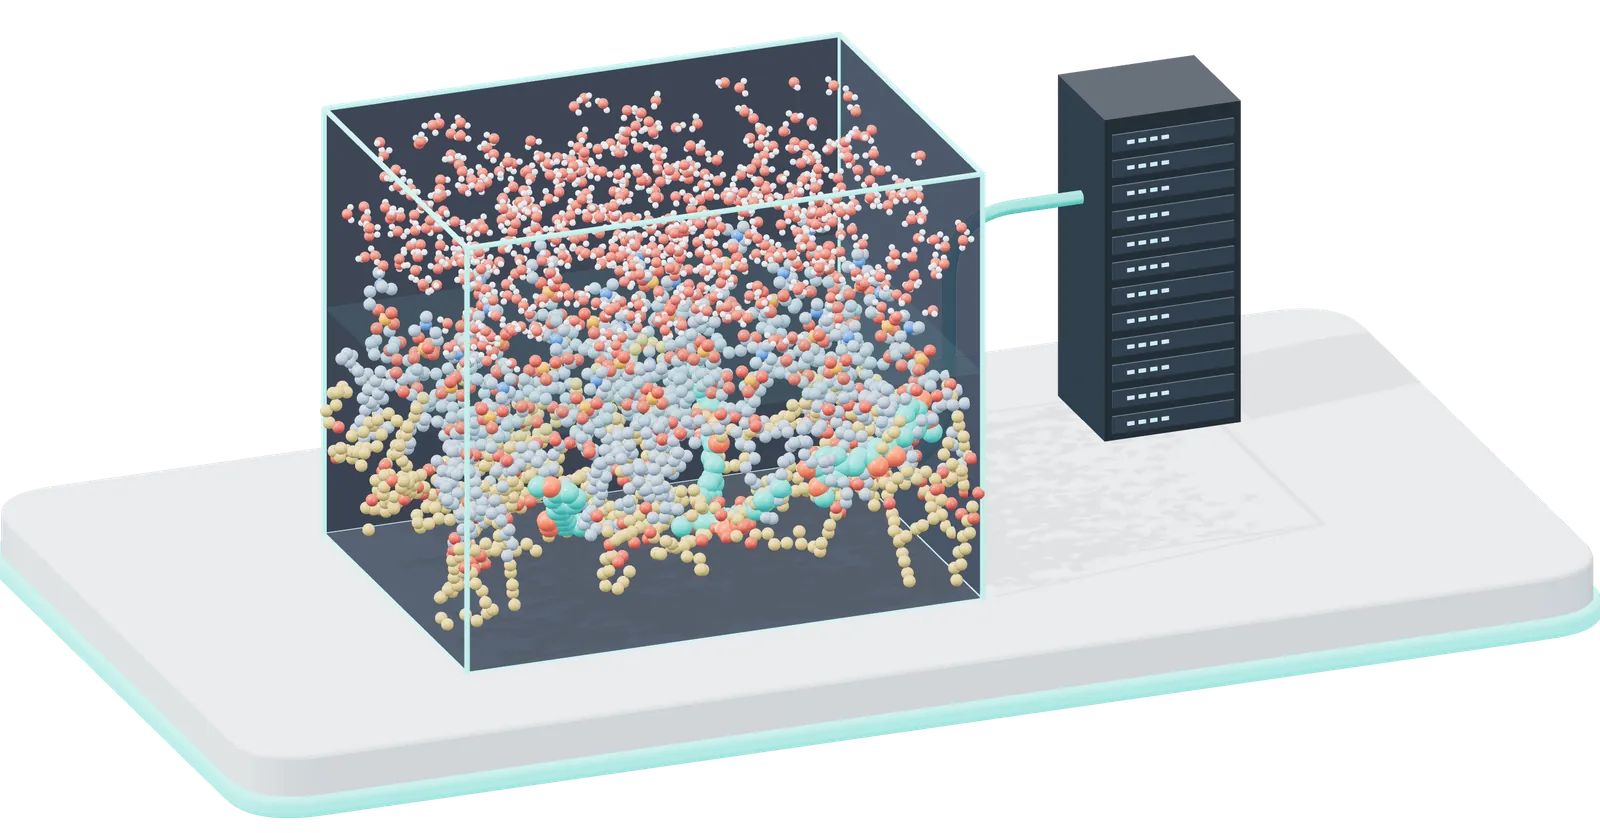
- 1 Water
- 2 Phospholipid layer at the oil–water interface: heads in the water, tails in the oil (POPC)
- 3 Oil phase: medium-chain triglyceride (glyceryl tricaprylate)
- 4 Curcumin, the lipophilic ingredient, dissolved in the oil
- 5 Periodic box: a molecule leaving one face re-enters the opposite face
- 6 GPU server integrates the equations of motion in femtosecond steps
Set-up of an all-atom simulation for choosing an oil and an emulsifier, rendered by EUTECNIQ. Every molecule is a real 3D structure (RDKit ETKDG conformers minimized with MMFF94: glyceryl tricaprylate, POPC, curcumin, water); positions are arranged by hand and atoms crossing a side of the box are wrapped to the opposite side, as periodic boundaries do. This is the set-up, not a simulation result; EUTECNIQ has not yet run these simulations.
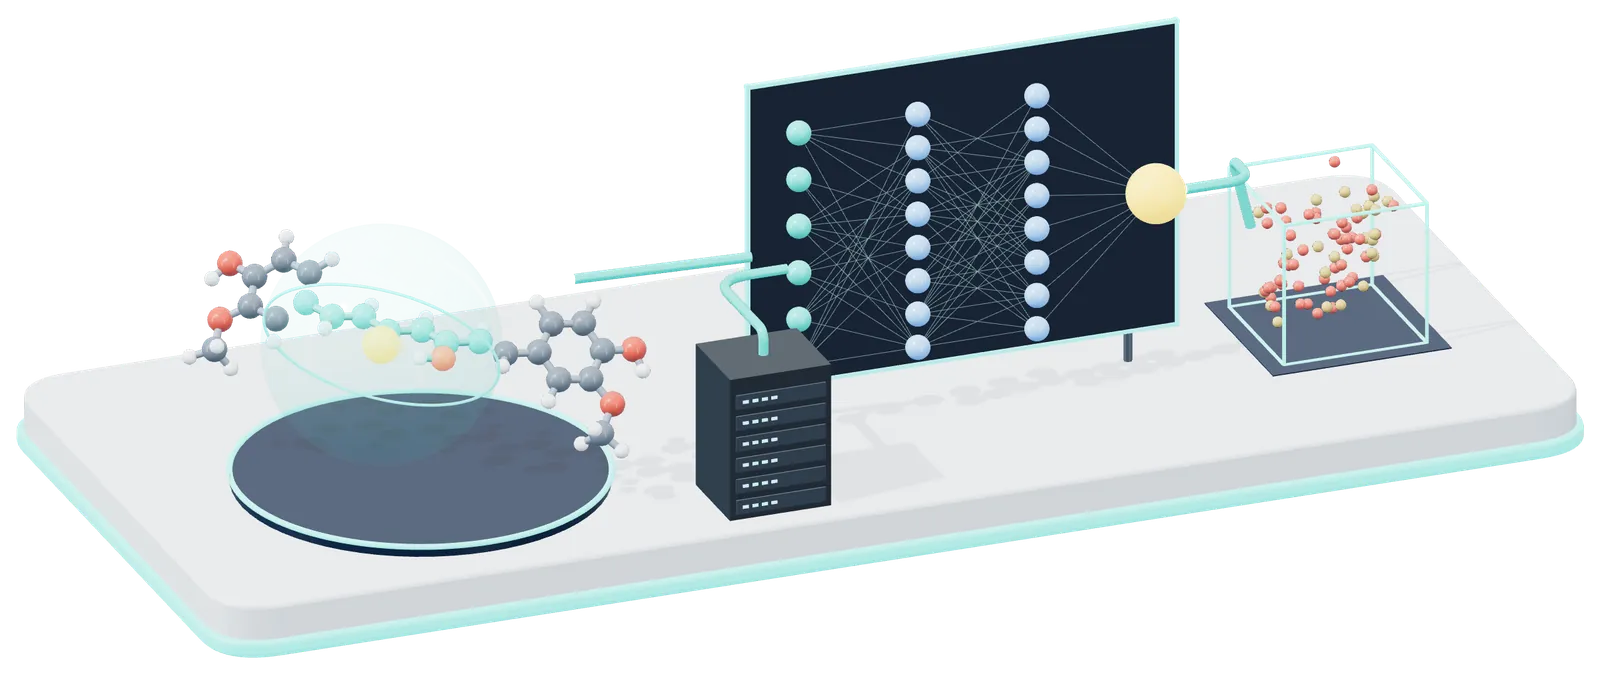
- 1 Each atom and its neighbors within a cutoff radius (5 Å shown)
- 2 Learned network turns each neighborhood into an atomic energy
- 3 Total energy E; forces F = −∂E/∂r
- 4 Trained on quantum-chemistry (DFT) energies and forces
- 5 Forces drive molecular dynamics, far faster than the quantum calculations
How a machine-learned force field works, rendered by EUTECNIQ: each atom’s surroundings within a cutoff go through a learned network to an atomic energy; the sum is the energy and its negative gradient gives the forces (Behler and Parrinello 2007). ANI-1 and MACE-OFF are published examples trained on quantum-chemistry data. The curcumin coordinates are real (RDKit, MMFF94); the network size is illustrative.
The COSMO-SAC screen, its σ-profiles and how far to trust it
04 · The process, optimized as a whole
Every route is in the model; the optimizer keeps the best one.
Mixed-integer nonlinear programming chooses discrete options (which extraction method, which solvent, which dryer) and continuous conditions (temperature, pressure, ratios) together, under mass and energy balances. It is standard in chemical process design and, in EUTECNIQ’s assessment of the literature, rare in botanical extraction.

- 1 Every candidate unit and connection is in the model
- 2 Binary choices: which units; continuous: temperature, pressure, ratios
- 3 The optimizer keeps one route that best meets the objectives
An illustrative superstructure, rendered by EUTECNIQ. Units and the highlighted route are examples, not an optimization result.
- 1 Superstructure: every candidate unit and every connection is in one model
- 2 Integer decisions: which unit is used at each step
- 3 Continuous decisions: temperature, pressure, flows, solvent ratio
- 4 Selected route, shown solid (illustrative); the rest stay as alternatives
- 5 Solver: mixed-integer nonlinear programming (MINLP)
A superstructure with real equipment types, rendered by EUTECNIQ. Mixed-integer nonlinear programming chooses the units and their conditions together. The selected route is an illustration, not an optimization result.
Most ingredients have several goals that conflict: recover more, spend less energy, finish faster. Multi-objective optimization returns the set of designs where no goal can improve without another getting worse, the Pareto front, and a genetic algorithm can find that front without testing every option.
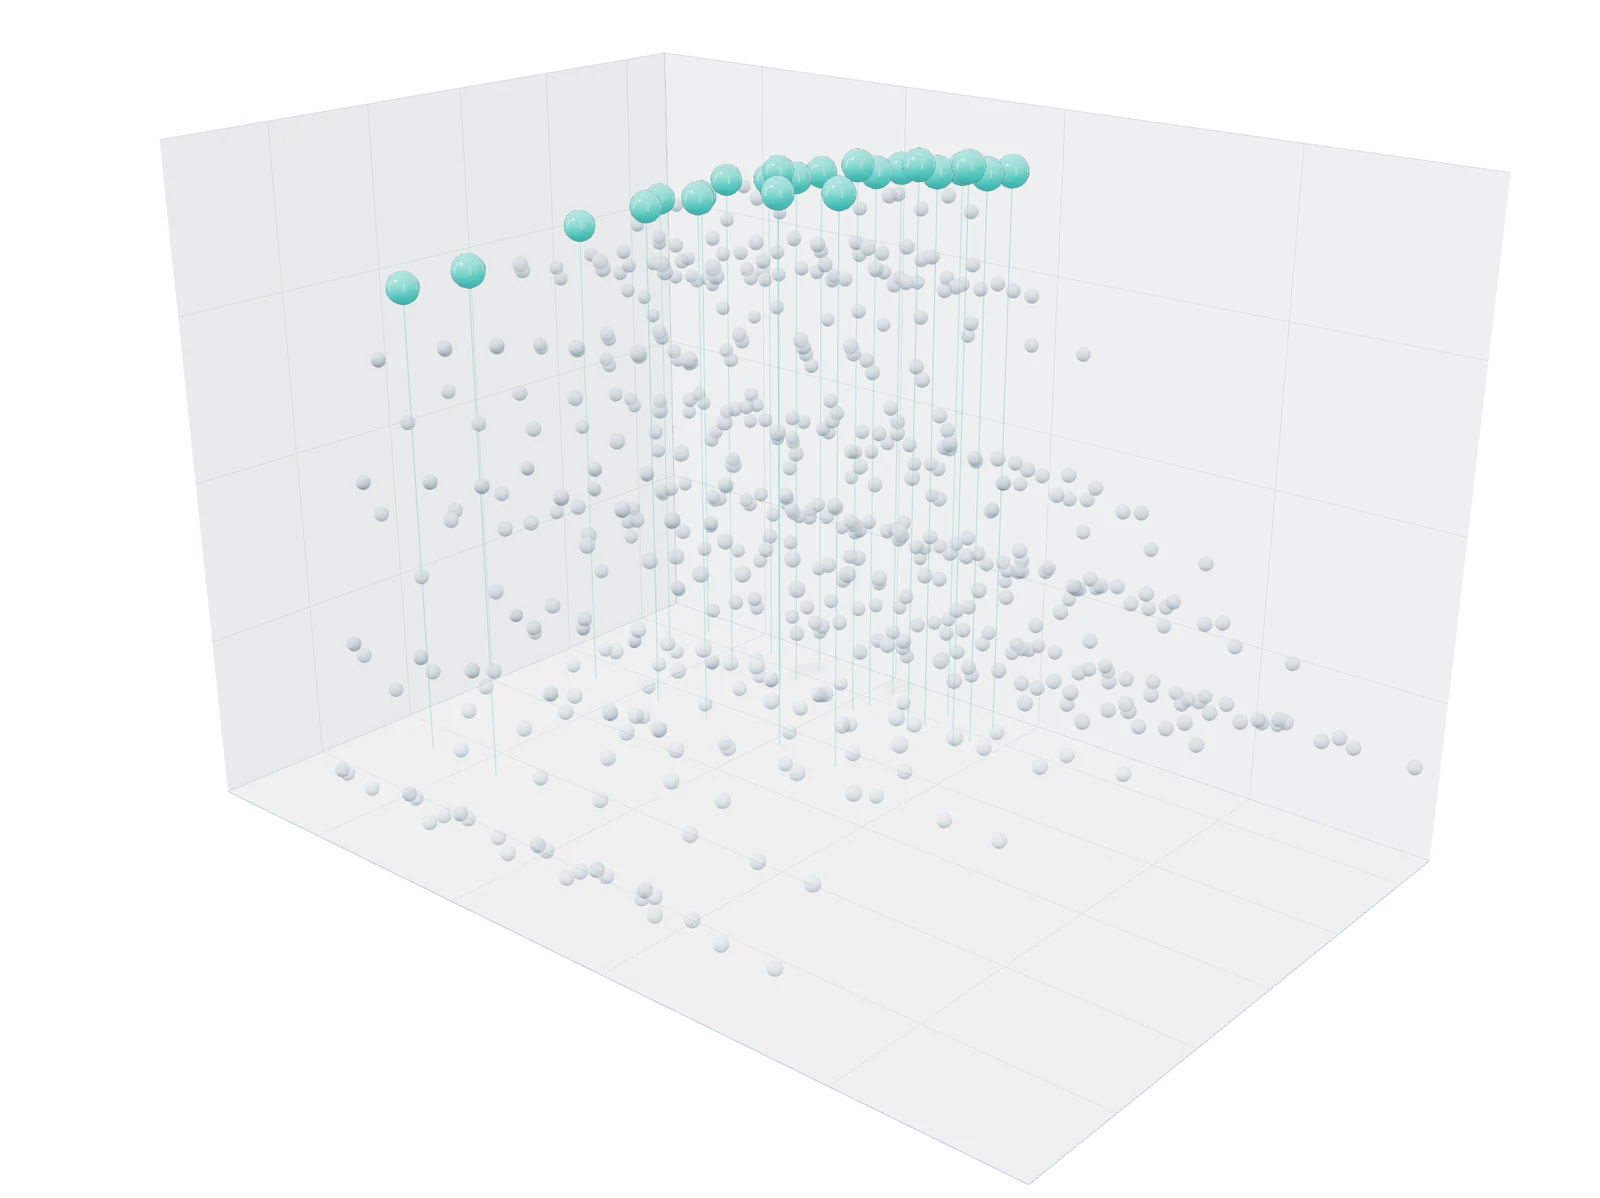
- 1 23 non-dominated designs
- 2 577 dominated designs
Data: FIG 020, a 5 × 6 × 5 × 4 full-factorial sweep of the illustrative extraction simulator (particle size, solvent ratio, temperature, hold time). Every material input is assumed, not measured; the method, not the optimum, is the result.
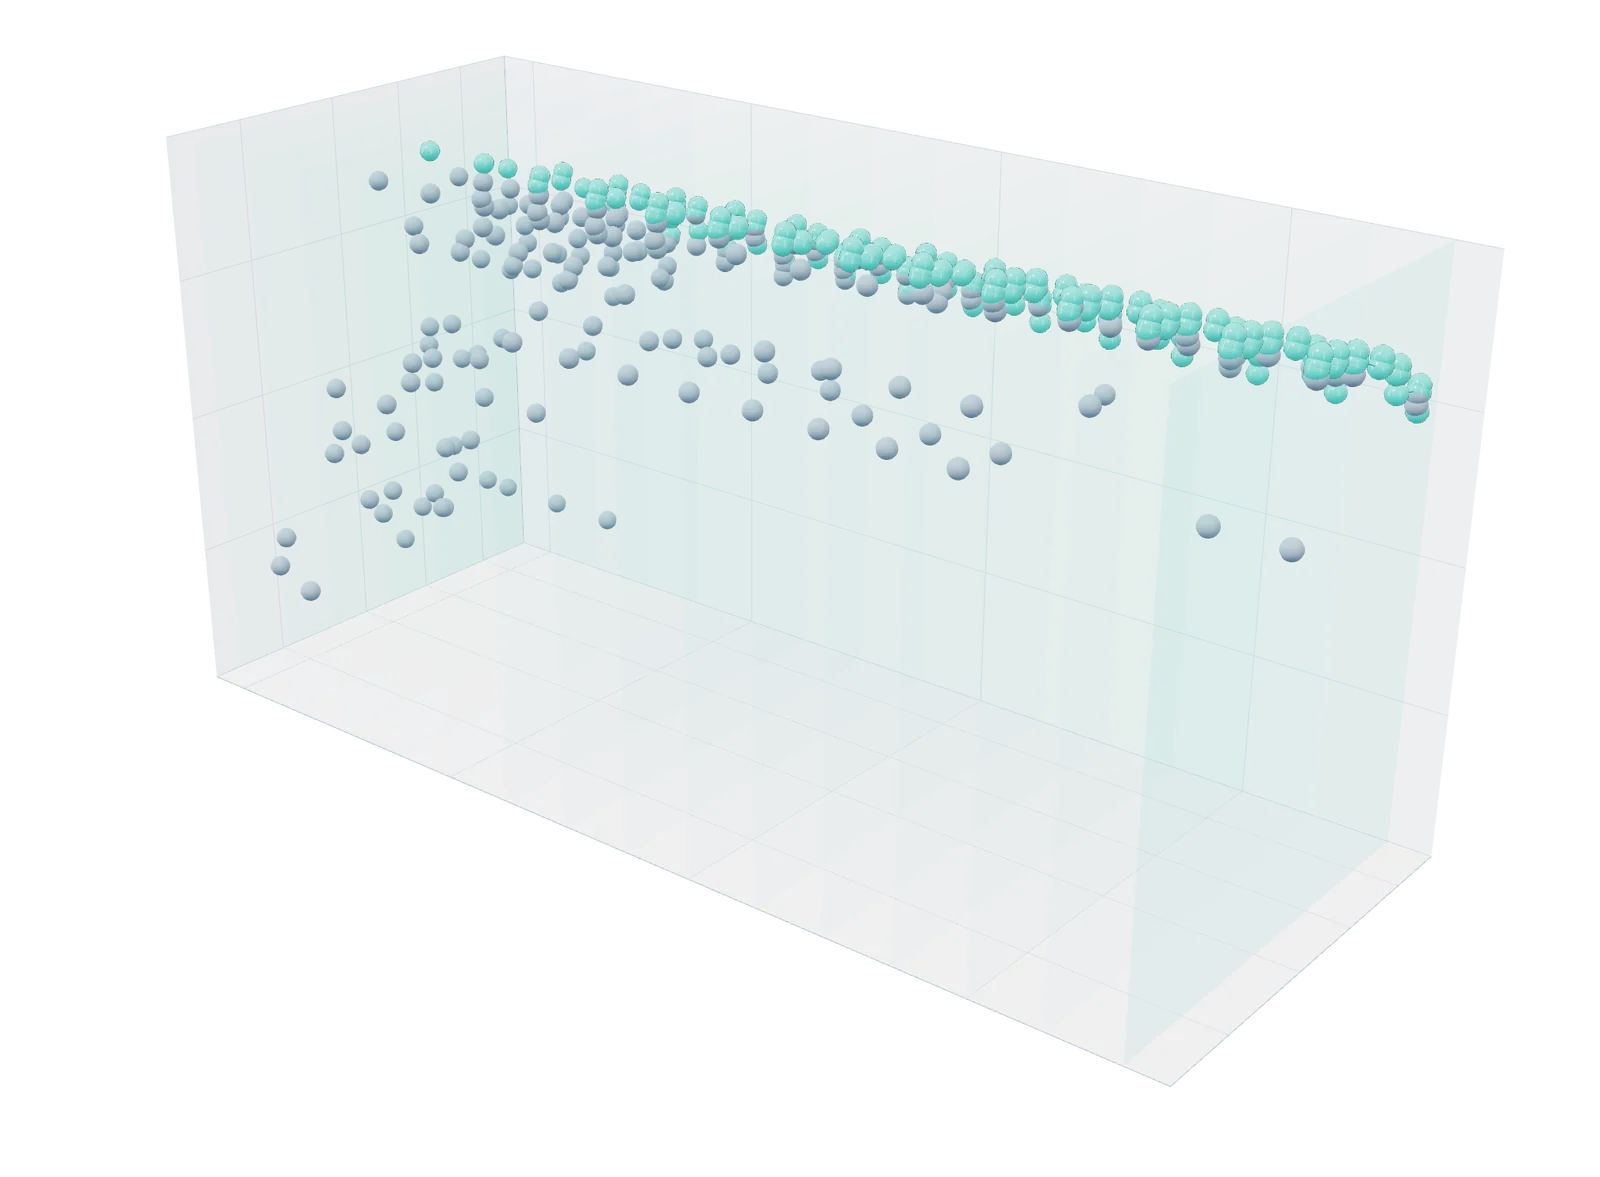
- 1 Random start: no design on the front
- 2 Generation 14: all 23 front designs found
Genetic search (NSGA-II-style selection, uniform crossover, mutation) run for this page on FIG 020’s design table: 28 designs per generation, 14 generations, at most 420 evaluations including repeats. Exhaustive enumeration of all 600 gives the 23-design front it is checked against.
Computational fluid dynamics solves the flow equations inside the equipment. It shows where a vessel mixes poorly, how two feeds blend, and how temperature and residence time vary in a dryer, so a scale-up can be checked on the computer before a pilot run. The example below is a real calculation run for this page.
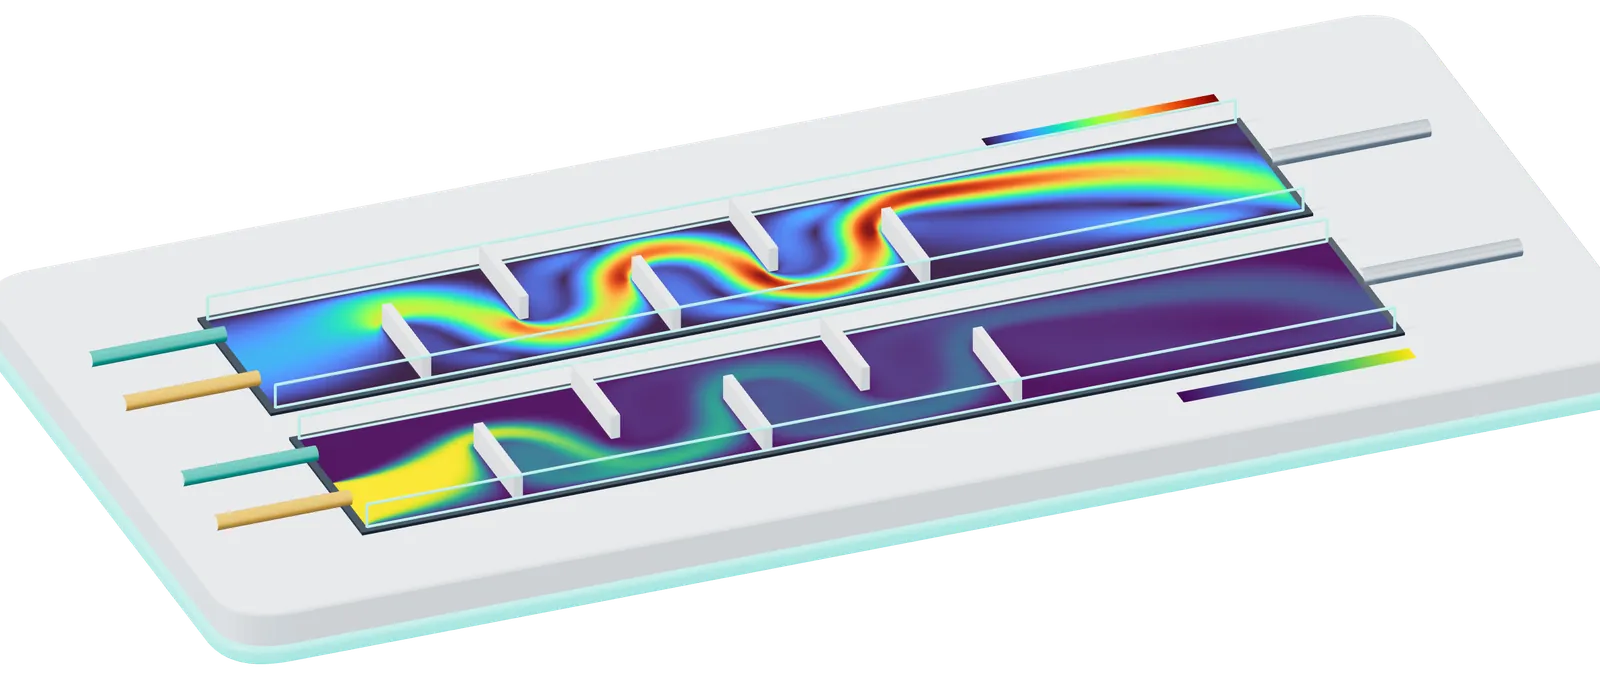
- 1 Feed A (amber)
- 2 Feed B (teal)
- 3 Baffles turn the flow; jets and eddies form behind each one
- 4 Speed of the flow, relative to the mean inlet speed
- 5 Fraction of feed A: the two streams blend baffle by baffle
- 6 Outlet
Color scales: speed from 0 to 6.5 times the mean inlet speed; fraction of feed A from 0 to 1. Computed by EUTECNIQ for this page: two-dimensional lattice Boltzmann method (D2Q9, single-relaxation-time BGK; Zou–He velocity inlet and pressure outlet), 560 × 96 lattice, Reynolds number 52 based on channel width and mean inlet speed, a snapshot after 110,000 time steps; density stayed within 1% below to 5% above its outlet value, so compressibility error is small. Feed A’s fraction is a passive scalar carried by the computed flow with a first-order upwind scheme, whose numerical diffusion overstates mixing. Illustrative geometry; a 2D laminar calculation, not validated against experiment and not a design of any EUTECNIQ equipment.
05 · Physics plus learning, with honest uncertainty
First-principles models, corrected by machine learning, judged by probability.
EUTECNIQ’s models start from physics and empirical correlations (diffusion, Arrhenius kinetics, mass balances), then learn what the physics misses from measured data. Bayesian statistics carry the uncertainty through, so a design is chosen for the probability it meets a specification, not for a single best guess.
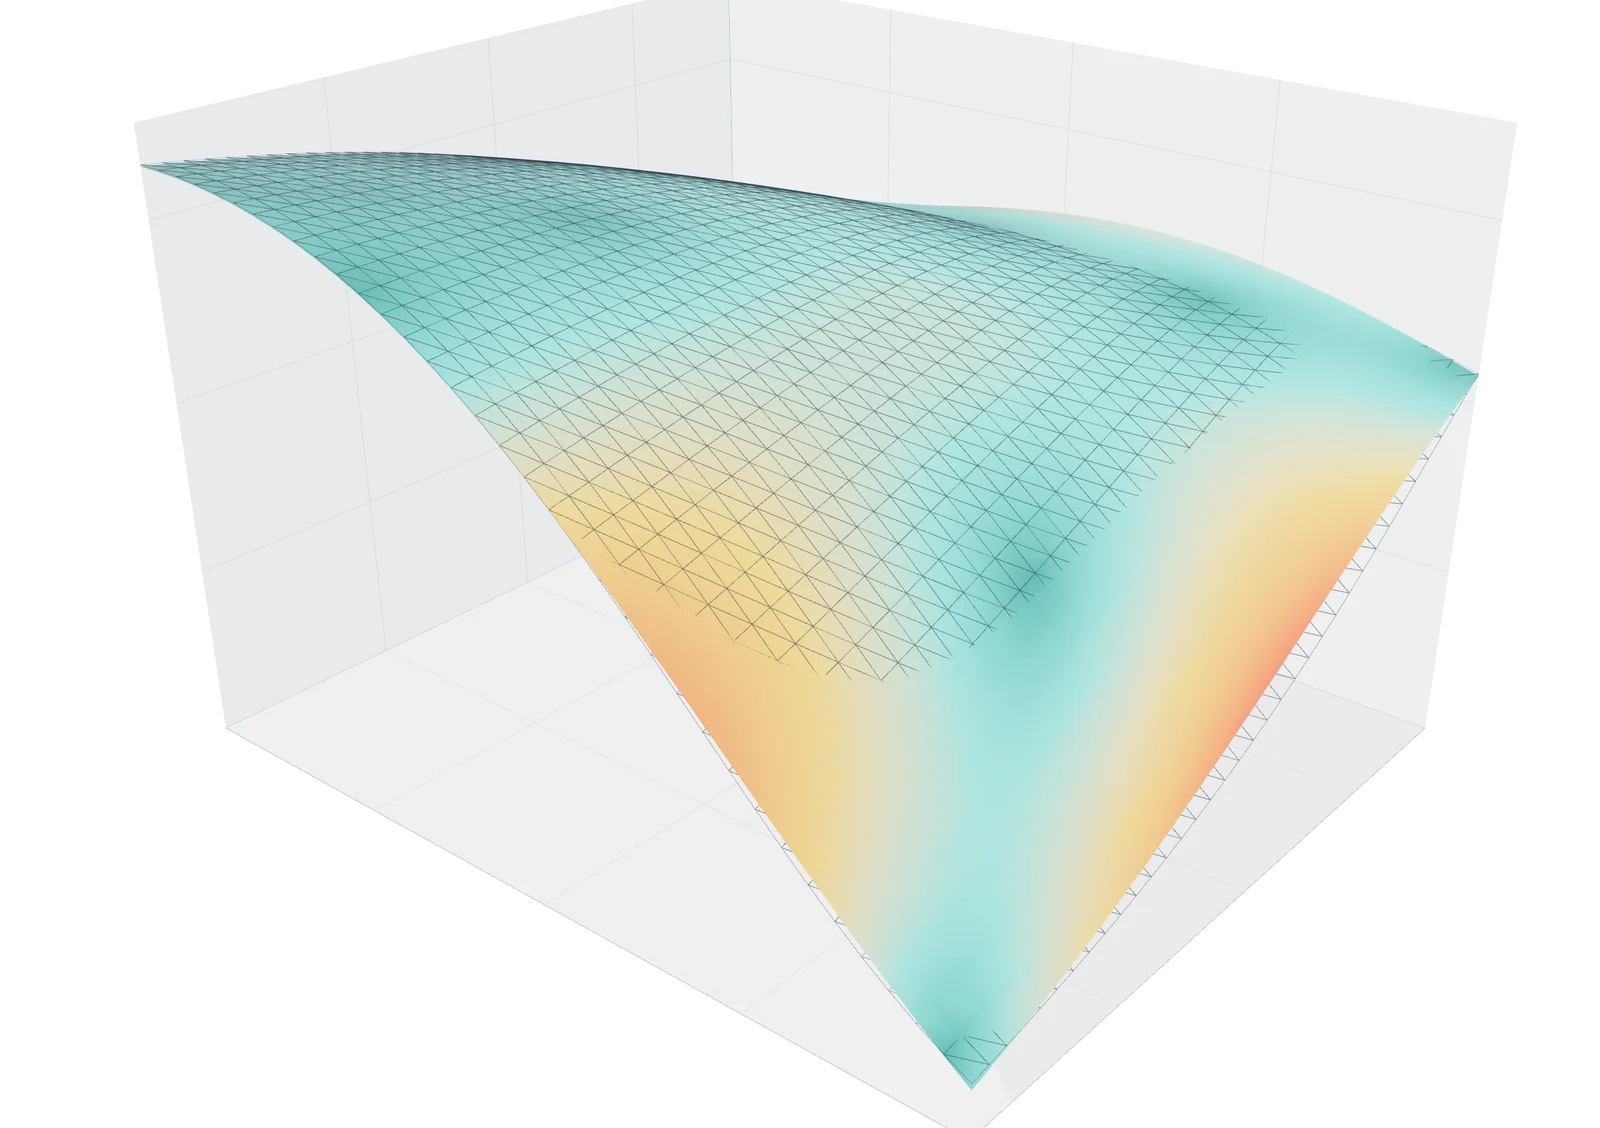
- 1 Learned surface: Gaussian process from 15 runs
- 2 Wireframe: the full simulator, 1,296 grid points
- 3 Color: model uncertainty, low (teal) to high (red)
Data: FIG 047. Gaussian-process surrogate fitted to 15 runs (5 random, 10 chosen by expected improvement) against the 1,296-point simulator grid. Illustrative simulator; all material parameters assumed.
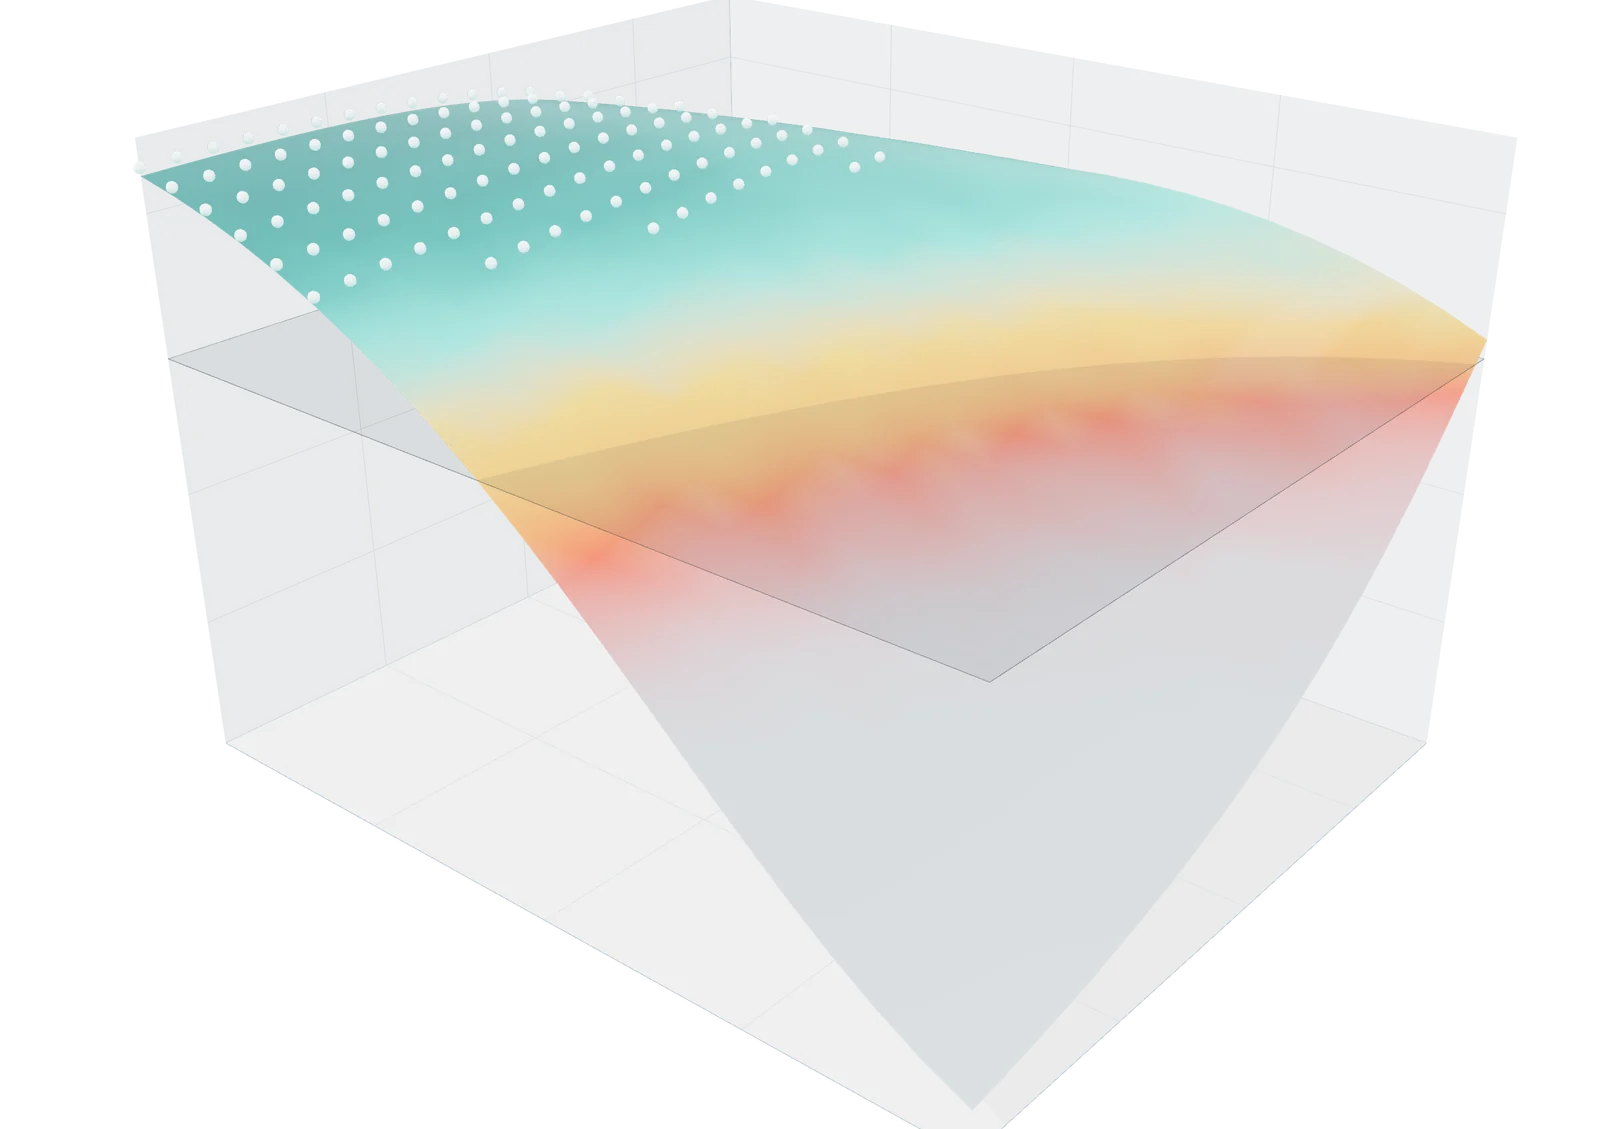
- 1 Studs: settings that meet the target with at least 90% probability
- 2 Color: probability of meeting 60%, from gray (0) through red to teal (1)
Data: FIG 052. Monte Carlo, 80 draws of the uncertain material parameters at each of 441 settings. The 60% target is an arbitrary illustration; illustrative simulator.

- 1 Extraction vessel runs one experiment
- 2 Online analysis measures intact recovery
- 3 Bayesian optimizer updates its surrogate model and picks the next run (screen: FIG 047)
- 4 Controller sets the next temperature and hold time
- 5 Data loop: each run improves the next choice
Closed-loop experimentation (Bayesian optimization), rendered by EUTECNIQ. The screen is FIG 047: the Gaussian-process mean after 15 runs of the illustrative simulator, with its predicted best setting marked. Proposed for the laboratory; no such loop runs yet.
Physics core, learned correction · Scientific Intelligence program
06 · Learning across botanicals
One model that learns from every lot, every plant and every format.
Each authenticated lot would be measured the same way, so a model can learn across species, origins, processes and delivery systems. A physics model gives the baseline and the network learns the correction; it is judged on material it has never seen, against the simplest method that could do the job.
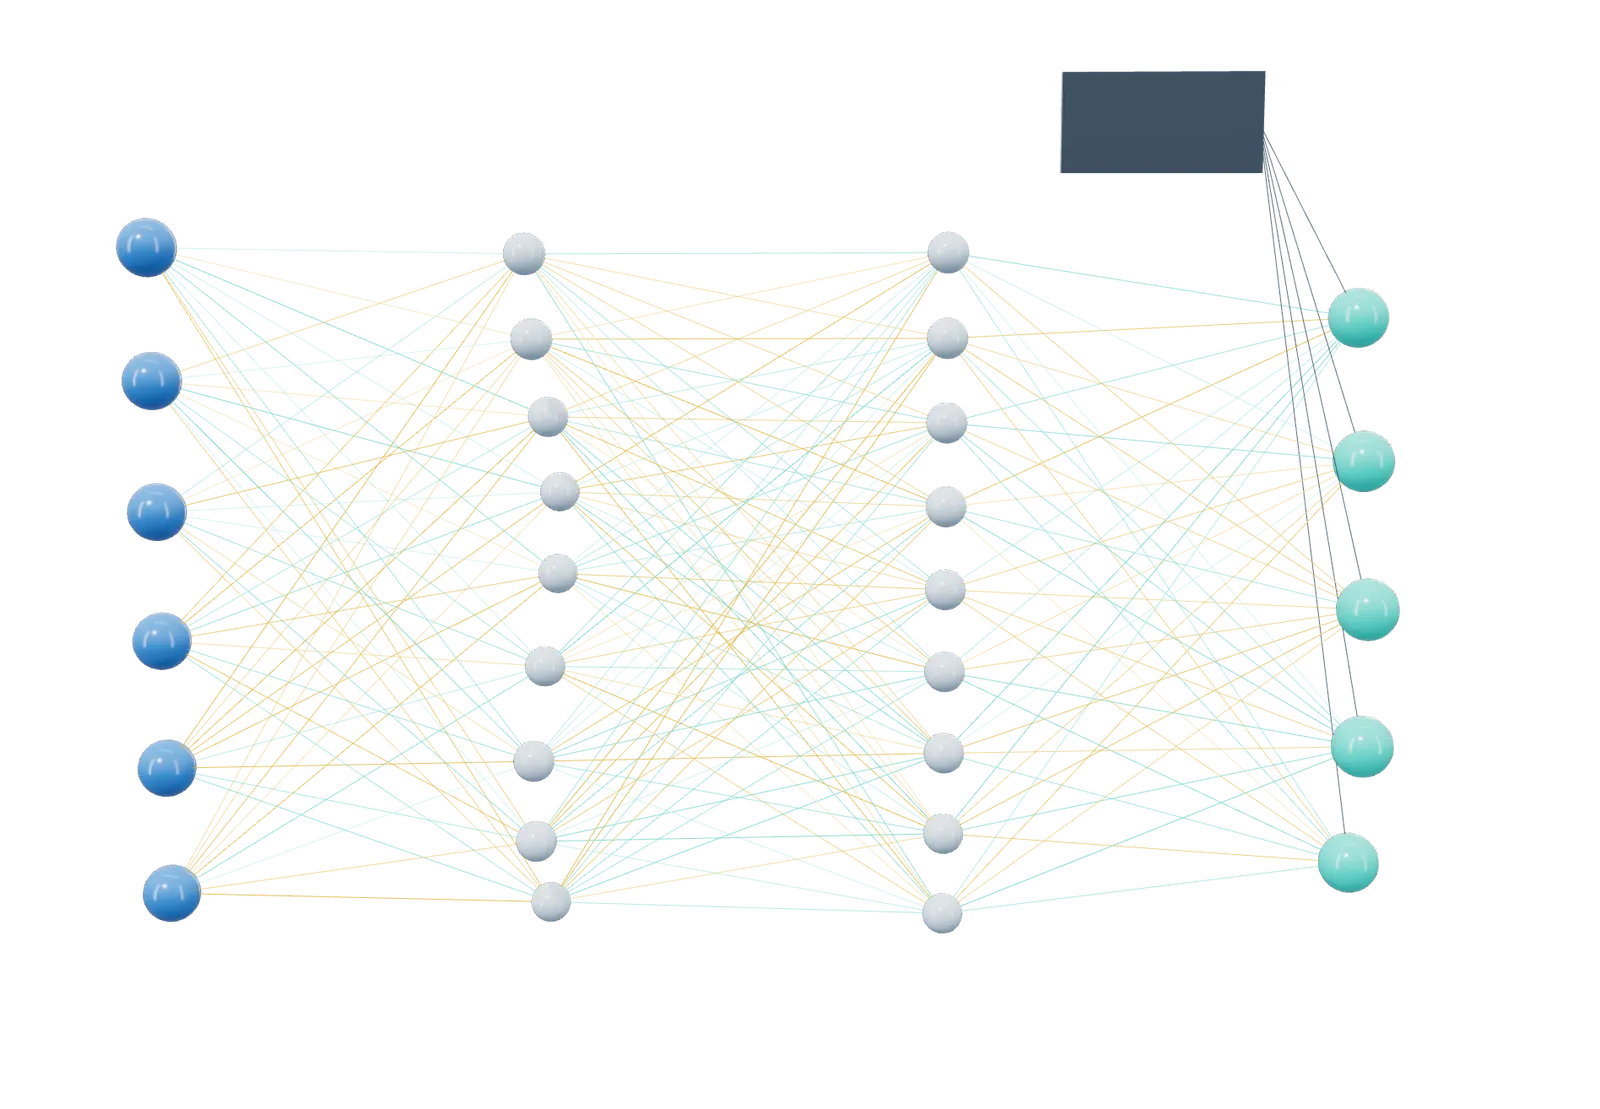
- 1 Inputs: fields of the authenticated lot record
- 2 Learned layers
- 3 Physics model supplies the baseline; the network learns the correction
- 4 Outputs, each with an uncertainty
Illustrative architecture, rendered by EUTECNIQ; connection colors are decorative weights. No such model has been trained; it would be trained only on authenticated lot data.
Large botanical model: data, adaptation and the wet-lab loop · The data asset
07 · Exposure, not dose
Judge an ingredient by what reaches the blood.
EUTECNIQ has calibrated pharmacokinetic models for curcumin, quercetin and berberine on published human data with Bayesian inference. The same models would judge each final format: a format is better only if it changes exposure, and the model says by how much and with what certainty.
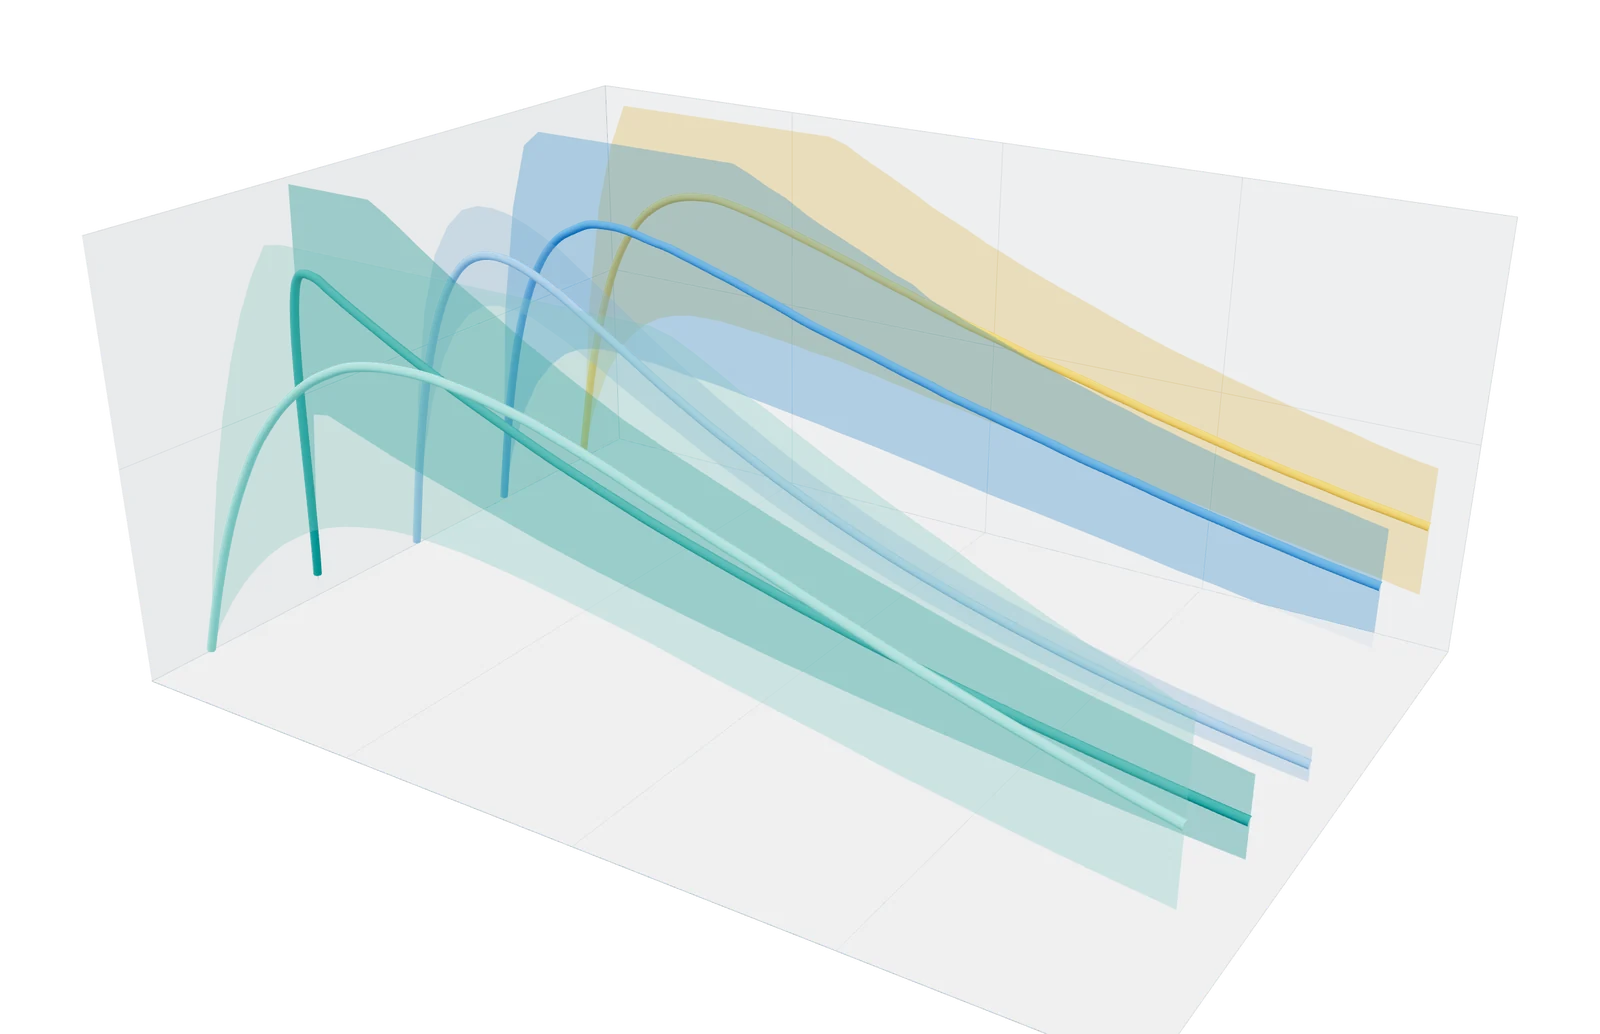
- 1 Line: posterior median
- 2 Band: 90% credible interval
Data: FIG 032. Posterior median and 90% interval of the typical-subject curve for each published dataset (PyMC NUTS, 4 chains × 2,000 draws). Each curve is scaled to its own peak, so heights are not comparable across ribbons.

- 1 Dose
- 2 Plasma height: posterior median concentration at each sampling time
- 3 Bayesian model: median and 90% band; dots are the tubes
Data: FIG 032, curcumin conjugates: posterior median plasma concentration of the typical subject at each time (PyMC, calibrated on Vareed et al., Cancer Epidemiol Biomarkers Prev 2008). Plasma height is scaled to the peak; the screen shows the median and 90% interval. Tubes and dose are schematic.
08 · Designed in its final format
The ingredient, its delivery system and its dosage form, designed together.
Solubility, stability and exposure depend on the extract, the carrier around it and the form it is sold in, all at once. Designing them together, with the models above, gives an ingredient that is ready for a product. That ingredient, where EUTECNIQ funds the work, is EUTECNIQ’s to use in its own products and to license.
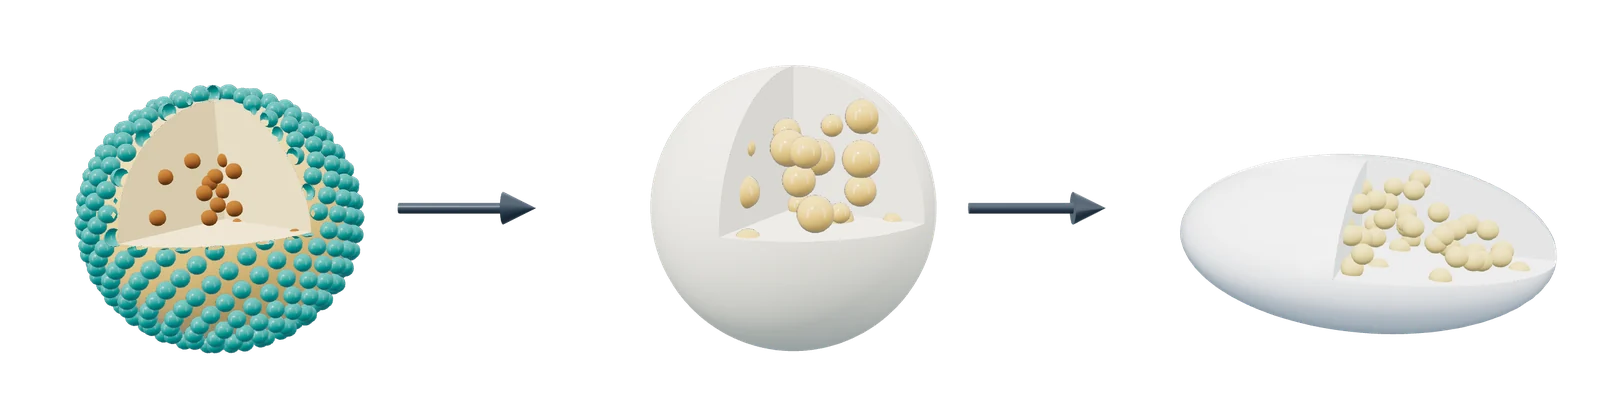
- 1 Extract held in oil droplets, sized for dispersion
- 2 Droplets fixed in a dry matrix particle
- 3 Particles pressed into the final dosage form
Final-format design, rendered by EUTECNIQ; schematic and not to scale. The forms shown are examples.

- 1 Blending: ingredient plus excipients
- 2 Encapsulation
- 3 Bottle filling and induction sealing
- 4 Labeling and lot coding
- 5 Packed and released against the finished-product specification
From ingredient to finished product, rendered by EUTECNIQ from generic equipment types; no brand is shown. EUTECNIQ has no products yet; this is the proposed path for ingredients it designs and owns.
09 · What exists today
Computed today; proposed for the laboratory.
| Layer | Exists today | Proposed |
|---|---|---|
| Molecule | Conformers of 3 molecules; COSMO-SAC screen of 13 | Measured solubility to test and correct the screen |
| Process | Optimization methods shown on an illustrative simulator | Models fitted to measured extraction data; superstructure optimization |
| Exposure | Bayesian PK calibrated on published human data | Models applied to each final format |
| Molecular simulation | Simulation set-up and method shown; no simulation run | Molecular dynamics of candidate oils, emulsifiers and carriers, with machine-learned force fields where tested |
| Flow | One 2D lattice Boltzmann example, computed for this page | CFD of mixing, extraction and drying equipment for scale-up |
| Learning | Methods, metrics and stopping rules written in advance | Models trained on authenticated lot records |
| Market | None | Owned ingredients, products and licenses |
For scale: U.S. herbal supplement retail sales were $13.2 billion in 2024 (Nutrition Business Journal data, Smith T, Lang C, Craft E. HerbalGram 2025;(144):46–69). This is the market context, not a forecast for EUTECNIQ. Information only; not an offer of securities.
Sources and methods
- MINLP in process design: Biegler LT, Grossmann IE, Westerberg AW. Systematic Methods of Chemical Process Design. Prentice Hall; 1997.
- Genetic multi-objective search: Deb K, Pratap A, Agarwal S, Meyarivan T. A fast and elitist multiobjective genetic algorithm: NSGA-II. IEEE Trans Evol Comput. 2002;6(2):182–197.
- Illustrative extraction simulator and FIG 020, 047, 052: Crank J. The Mathematics of Diffusion, 2nd ed., 1975; scripts and data on the figures page.
- Bayesian PK, FIG 032: PyMC NUTS on published summary data (Vareed et al., Cancer Epidemiol Biomarkers Prev 2008;17:1411–1417, and the other sources listed with the figure).
- Curcumin structure: PubChem CID 969516; conformers by RDKit ETKDG with MMFF94; Gasteiger charges by RDKit.
- Machine-learned force fields: Behler J, Parrinello M. Generalized neural-network representation of high-dimensional potential-energy surfaces. Phys Rev Lett. 2007;98:146401. Smith JS, Isayev O, Roitberg AE. ANI-1: an extensible neural network potential with DFT accuracy at force field computational cost. Chem Sci. 2017;8:3192–3203. Kovács DP et al. MACE-OFF: short-range transferable machine learning force fields for organic molecules. J Am Chem Soc. 2025;147(21):17598–17611.
- Molecular simulation in pharmaceutics: Hossain S, Kabedev A, Parrow A, Bergström CAS, Larsson P. Molecular simulation as a computational pharmaceutics tool to predict drug solubility, solubilization processes and partitioning. Eur J Pharm Biopharm. 2019;137:46–55.
- Lattice Boltzmann method: Krüger T, Kusumaatmaja H, Kuzmin A, Shardt O, Silva G, Viggen EM. The Lattice Boltzmann Method: Principles and Practice. Springer; 2017. Velocity inlet: Zou Q, He X. Phys Fluids. 1997;9:1591–1598.
- Simulation-box molecules: glyceryl tricaprylate, POPC and water conformers by RDKit ETKDG with MMFF94, generated for this page.
Health information notice. These statements have not been evaluated by the Food and Drug Administration. Nothing on this site is intended to diagnose, treat, cure or prevent any disease, and nothing here is medical advice.
Read the full notice
The information is for general education only. It does not replace advice, diagnosis or treatment from a qualified health professional, or any medication a clinician has prescribed. Do not start, stop or change any medicine, supplement or herbal product because of something you read here. Talk to your doctor or pharmacist first, especially if you are pregnant or breastfeeding, have a medical condition, take any medicines, are preparing for surgery, or are caring for a child. Research findings, traditional uses and safety data are reported as their sources state them; they are not recommendations or claims about any product. If you think you may have a medical emergency, call your doctor or 911 at once.
EUTECNIQ Sciences sells no supplements or health products today and receives nothing from any product or ingredient mentioned on this site; any commercial interest it later has in an ingredient will be stated on that ingredient’s page.