

Optimizing an extraction means meeting every specification with stated confidence, then choosing by cost
One open-access botanical extraction study rebuilt from its published tables: response surfaces, desirability, a three-objective NSGA-II search and a probabilistic design space. Coefficients are the paper's; everything else is computed from its data.
Status. EUTECNIQ has not run this experiment and has no laboratory data; the black cumin seed study is a published data set, and the page makes no health claim.
Academy fundamentals: Course 11, Multi-objective ingredient design
Two reference molecules define the two responses: gallic acid for total phenolics and the DPPH radical for scavenging
Assay references
Gallic acid
- Formula
- C₇H₆O₅
- Molar mass
- 170.12 g/mol
- PubChem CID
- 370
- Role here
- Calibration standard: total phenolic content is reported in mg gallic acid equivalent (GAE) per g
DPPH radical
- Name
- 2,2-diphenyl-1-picrylhydrazyl
- Formula
- C₁₈H₁₂N₅O₆
- Molar mass
- 394.3 g/mol
- PubChem CID
- 2735032
- Role here
- A stable radical; the DPPH response is the percentage of it an extract removes in a test tube
One open-access study publishes everything needed to rebuild its models: 16 runs, coded levels and both coefficient tables
Text version of the experiment
- Seeds bought at a local market in Mascara, Algeria (March 2022), milled and defatted with hexane.
- Each run extracted 5 g of powder with 200 mL of ethanol–water in an ultrasonic bath at 110 W and 40 kHz.
- Factors: ethanol 30, 60 and 90% (v/v); sonication temperature 25, 50 and 75 °C; sonication time 15, 30 and 45 min.
- Responses: total phenolic content (TPC, Folin–Ciocalteu, mg gallic acid equivalent per g) and DPPH radical scavenging (% of the radical removed by a 2 mg/mL extract solution) In vitro.
- Sixteen runs: 12 edge midpoints and 4 centre points, fitted with full second-order models.
The DPPH result is a chemical assay in a test tube. It says nothing about antioxidant effects in people.
Second-order polynomials in coded units put every coefficient on one scale
Coding maps each factor's low, middle and high levels to −1, 0 and +1, so a coefficient gives the change for a half-range step and the quadratic terms show curvature.
Drag to rotate, or use the buttons. The four centre points coincide at 60%, 50 °C, 30 min.
Show data (Table 1 of the paper)
| Run | Ethanol (%) | Temperature (°C) | Time (min) | TPC (mg GAE/g) | DPPH (%) |
|---|---|---|---|---|---|
| 1 | 60 | 25 | 45 | 28.4 | 65.1 |
| 2 | 30 | 25 | 30 | 25.7 | 44.8 |
| 3 | 60 | 75 | 15 | 21.8 | 35.5 |
| 4 | 60 | 50 | 30 | 35.1 | 70.5 |
| 5 | 30 | 50 | 45 | 24.3 | 39.4 |
| 6 | 90 | 25 | 30 | 24.5 | 44.5 |
| 7 | 30 | 50 | 15 | 24.3 | 36.8 |
| 8 | 60 | 50 | 30 | 35.6 | 68.0 |
| 9 | 60 | 75 | 45 | 21.1 | 44.5 |
| 10 | 60 | 50 | 30 | 35.2 | 69.1 |
| 11 | 60 | 50 | 30 | 35.1 | 69.0 |
| 12 | 60 | 25 | 15 | 22.2 | 41.5 |
| 13 | 90 | 75 | 30 | 19.2 | 45.4 |
| 14 | 90 | 50 | 45 | 22.6 | 64.0 |
| 15 | 30 | 75 | 30 | 20.4 | 35.0 |
| 16 | 90 | 50 | 15 | 19.3 | 38.8 |
Text version: coefficient table and checks
| Term | TPC coefficient | TPC p-value | DPPH coefficient | DPPH p-value |
|---|---|---|---|---|
| Intercept β0 | 35.25 | <0.0001 (model) | 69.15 | 0.0005 (model) |
| x1 ethanol | −1.14 | 0.0082 | 4.59 | 0.0118 |
| x2 temperature | −2.29 | 0.0002 | −4.44 | 0.0136 |
| x3 time | 1.10 | 0.0095 | 7.55 | 0.0011 |
| x1x2 | 0.0000 | 1.0000 | 2.67 | 0.1914 |
| x1x3 | 0.8250 | 0.0941 | 5.65 | 0.0209 |
| x2x3 | −1.72 | 0.0060 | −3.65 | 0.0913 |
| x12 | −6.78 | <0.0001 | −14.31 | 0.0002 |
| x22 | −6.02 | <0.0001 | −12.41 | 0.0005 |
| x32 | −5.85 | <0.0001 | −10.09 | 0.0014 |
| R2 · adjusted R2 | 0.9924 · 0.9811 | 0.9728 · 0.9320 | ||
| Coefficient of variation | 3.20% | 7.16% | ||
| Lack of fit (F, p) | 23.34, 0.0140 | 24.00, 0.0134 | ||
| Predicted R2 (leave-one-out, EUTECNIQ computation) | 0.883 | 0.580 | ||
The refit reproduces the table
A least-squares fit of the 16 published runs gives every Table 2 coefficient to within 0.005, and the same R2, adjusted R2, coefficient of variation and lack-of-fit F. The page uses the published coefficients.
EUTECNIQ computationLack of fit is significant for both models
The four centre points agree closely (pure error), and the residuals are larger than that agreement allows (p = 0.014 and 0.013). The quadratic surfaces miss some real structure, so predictions carry more error than R2 suggests.
From Table 2The DPPH model predicts new runs less well
Leaving each run out in turn and predicting it gives a predicted R2 of 0.883 for TPC and 0.580 for DPPH. The 95% prediction interval at the optimum is about ±2.3 mg GAE/g for TPC and ±9.9 points for DPPH.
EUTECNIQ computationExplanation, details and sources
Gueffai and co-authors optimized ultrasound-assisted extraction of phenolics from defatted black cumin seed (Nigella sativa L.) with a three-factor Box–Behnken design: runs at the edge midpoints of the experimental cube plus repeated centre points.
Two reporting errors in the paper do not affect these models: the text's Equation (2) lists Table 2's F-values as DPPH coefficients, and the text swaps two HPLC concentrations relative to Table 4. The refit confirms Table 2.
Both responses peak near 60% ethanol and 45 °C, and the desirability optimum reproduces the authors' reported conditions
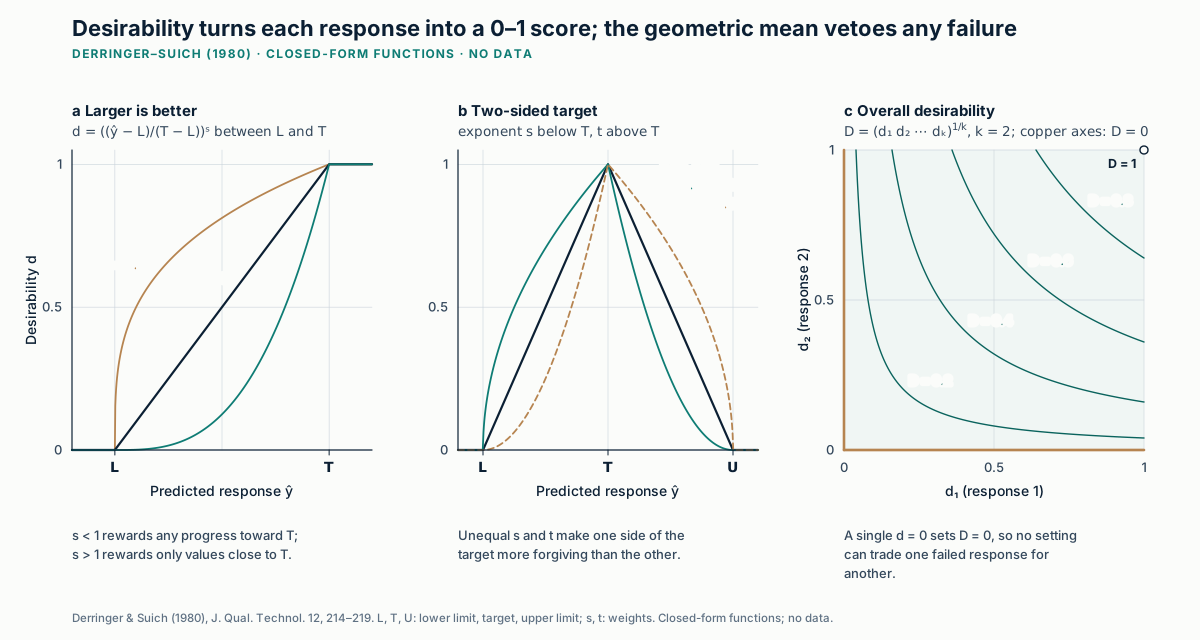
D = (d1 d2 ⋯ dk)1/k
Desirability settings (limits, targets, exponents)
Amber marks conditions whose predicted TPC and DPPH both meet the specifications. The ring marks the best D in this slice; the blue dot is the probe point.
Show data (predictions on a 7 × 7 grid of this slice)
| Ethanol (%) | 25 °C | 33.3 °C | 41.7 °C | 50 °C | 58.3 °C | 66.7 °C | 75 °C |
|---|---|---|---|---|---|---|---|
| The table fills in when the page's scripts run; Table 2 above gives the model needed to compute any value. | |||||||
Method, assumptions and limits
- What it calculates
- Predicted TPC and DPPH from the published coded models at any ethanol, temperature and time; Derringer–Suich individual and overall desirability; the slice of conditions meeting both specifications; the global desirability optimum; 95% prediction intervals at the probe point.
- Equations
- Models as in the table above. di as defined by Derringer and Suich (maximize, minimize or target, with exponents s and t; the page uses t = s); D = (d1d2)1/2. Prediction interval ±t0.975, 6 se √(1 + zᵀ(XᵀX)⁻¹z), with t0.975, 6 = 2.447 and residual standard deviations se = 0.830 (TPC) and 3.634 (DPPH) from the refit of Table 1.
- Variables and units
- Coded x1 = (ethanol − 60)/30, x2 = (temperature − 50)/25, x3 = (time − 30)/15; TPC in mg GAE/g; DPPH in % scavenged.
- Optimum search
- A 41 × 41 × 41 grid over the coded cube, then a pattern search with fixed pseudo-random directions to a step of 10⁻⁷, inside the design sphere when that option is on. The slice fraction counts a 61 × 61 grid.
- Assumptions
- The quadratic models hold within the design region; errors are independent and normal with constant variance; one lot of seed and one bath.
- Valid range
- 30–90% ethanol, 25–75 °C, 15–45 min. Inside the sphere of radius √2 the models interpolate between runs; at the cube's corners they extrapolate. Limits are reordered if a lower limit exceeds a target, and a warning appears.
- What it does not establish
- Performance at other scales, other seed lots or other equipment; any health effect; a validated design space. Significant lack of fit means the surfaces are approximations.
- References
- Gueffai et al. 2022; Box and Behnken 1960; Derringer and Suich 1980; NIST/SEMATECH e-Handbook 5.5.3.2.2.
- Verification
- An independent Python reference (numpy, scipy) recomputes the predictions, prediction intervals, slice fractions and optima, including the authors' reported optimum, in
tests/numerics/ref/insights-design-space-optimization.py.
Explanation, details and sources
Desirability turns each response into a score between 0 (unacceptable) and 1 (fully satisfactory) and combines them with a geometric mean, so a single unacceptable response sets the total to zero. With the scores spanning the observed ranges, the optimum falls at 59.2% ethanol, 44.7 °C and 32.5 min. The authors report 59.18%, 44.68 °C and 32.51 min.
A third objective, sonication time, turns one optimum into a front of trade-offs that NSGA-II maps in about 60 generations
Text version of the NSGA-II steps
Definitions
Condition a dominates b when a is no worse in every objective and strictly better in at least one. The non-dominated set is the Pareto front.
- Start. Draw a population of random conditions inside the cube.
- Make offspring. Pick parents by binary tournament, recombine them with simulated binary crossover and perturb them with polynomial mutation.
- Sort. Merge parents and offspring; rank them into successive non-dominated fronts (fast non-dominated sorting).
- Spread. Within a front, prefer points with a larger crowding distance, the size of the gap to their neighbours along each objective.
- Survive. Keep the best-ranked half and repeat. Conditions outside the design sphere lose to any condition inside it (constrained domination).
Deb K, Pratap A, Agarwal S, Meyarivan T. IEEE Trans Evol Comput. 2002;6(2):182–197. Operators and settings as in pymoo 0.6 (Blank and Deb, IEEE Access 2020).
Measuring a front
How the hypervolume is scaled
Objectives are scaled from an ideal value (0) to a reference value (1): TPC 36 to 20 mg GAE/g, DPPH 72 to 35%, time 15 to 45 min. The hypervolume is the fraction of that unit box the front dominates; larger is better.
Zitzler E, Thiele L. IEEE Trans Evol Comput. 1999;3(4):257–271; slicing algorithm: While L et al. IEEE Trans Evol Comput. 2006;10(1):29–38.
A large pymoo run (population 200, 300 generations) reaches a hypervolume of 0.785; that is close to the best this problem allows.
Show data (current front, sorted by time)
| Time (min) | Ethanol (%) | Temperature (°C) | TPC (mg GAE/g) | DPPH (%) |
|---|---|---|---|---|
| The table fills in when the optimizer runs. | ||||
Method, assumptions and limits
- What it calculates
- A three-objective Pareto front for the published models (maximize TPC, maximize DPPH, minimize sonication time), its hypervolume, and checks that its points are mutually non-dominated.
- Algorithm
- NSGA-II with constrained domination (feasible before infeasible; infeasible ranked by violation of xᵀx ≤ 2); binary tournament on domination and crowding distance; simulated binary crossover (ηc = 15, probability 0.9 per mating, 0.5 per variable); polynomial mutation (ηm = 20, probability 1/3 per variable); elitist survival on rank, then crowding distance.
- Determinism
- A seeded 32-bit generator (mulberry32) drives every random choice, so the same seed gives the same run in any browser. Play animates one generation at a time; with reduced motion it jumps to the end.
- Hypervolume
- Exact, by sweeping the time objective and summing two-dimensional dominated areas between successive time levels (hypervolume by slicing objectives).
- Assumptions
- Objectives are mean model predictions; uncertainty is treated in the next section. Time stands in for cost because power was constant.
- What it does not establish
- That front points meet specifications in practice. A point chosen at a specification limit has, at best, an even chance of meeting it.
- References
- Deb et al. 2002; Blank and Deb 2020; Zitzler and Thiele 1999; While et al. 2006.
- Verification
- The Python reference runs pymoo's NSGA2 with the same objectives and constraint and its hypervolume indicator. The page's run must come within 3% of pymoo's hypervolume for the same budget, and its front must contain no dominated pair. The same hypervolume routine applied to pymoo's stored front returns pymoo's own value to 10⁻⁶.
Data table: the 60 front points
| Ethanol (% v/v) | Temperature (°C) | Time (min) | TPC (mg GAE/g) | DPPH (%) | P(both) |
|---|---|---|---|---|---|
| 60.9 | 54.5 | 15.0 | 27.94 | 50.94 | 0.00 |
| 56.5 | 49.1 | 15.0 | 28.45 | 51.46 | 0.00 |
| 60.9 | 47.2 | 15.4 | 28.56 | 52.13 | 0.00 |
| 57.8 | 51.6 | 15.5 | 28.78 | 52.33 | 0.00 |
| 62.7 | 46.4 | 15.8 | 28.70 | 52.60 | 0.00 |
| 61.1 | 49.4 | 15.8 | 28.89 | 52.91 | 0.00 |
| 53.4 | 49.2 | 15.8 | 29.07 | 52.46 | 0.00 |
| 61.0 | 47.2 | 16.1 | 29.11 | 53.33 | 0.00 |
| 51.4 | 48.4 | 16.2 | 29.29 | 52.72 | 0.00 |
| 53.4 | 48.4 | 16.4 | 29.52 | 53.43 | 0.00 |
| 57.2 | 47.2 | 16.6 | 29.71 | 54.24 | 0.00 |
| 62.2 | 47.2 | 16.9 | 29.64 | 54.67 | 0.00 |
| 61.1 | 47.1 | 17.2 | 30.02 | 55.37 | 0.00 |
| 61.3 | 46.9 | 17.4 | 30.09 | 55.56 | 0.00 |
| 60.9 | 47.2 | 17.5 | 30.22 | 55.80 | 0.00 |
| 60.9 | 47.2 | 17.7 | 30.41 | 56.23 | 0.00 |
| 57.1 | 46.4 | 17.9 | 30.66 | 56.32 | 0.00 |
| 61.0 | 45.9 | 17.9 | 30.48 | 56.41 | 0.00 |
| 60.0 | 47.2 | 18.5 | 30.98 | 57.42 | 0.00 |
| 57.4 | 47.2 | 18.9 | 31.36 | 57.92 | 0.00 |
| 58.9 | 47.2 | 19.2 | 31.51 | 58.48 | 0.01 |
| 60.8 | 47.2 | 19.3 | 31.49 | 58.71 | 0.01 |
| 61.2 | 46.5 | 19.6 | 31.66 | 59.14 | 0.01 |
| 55.8 | 48.6 | 19.8 | 31.95 | 59.08 | 0.02 |
| 57.4 | 44.2 | 19.9 | 31.92 | 59.22 | 0.02 |
| 55.1 | 48.6 | 20.1 | 32.14 | 59.41 | 0.04 |
| 58.8 | 48.6 | 20.2 | 32.13 | 59.90 | 0.05 |
| 57.5 | 47.2 | 20.4 | 32.32 | 60.17 | 0.08 |
| 57.5 | 47.4 | 20.6 | 32.40 | 60.35 | 0.10 |
| 56.5 | 47.2 | 21.1 | 32.72 | 60.97 | 0.19 |
| 60.9 | 47.2 | 21.1 | 32.57 | 61.29 | 0.18 |
| 60.9 | 47.2 | 21.5 | 32.74 | 61.70 | 0.25 |
| 59.5 | 47.4 | 21.6 | 32.91 | 61.89 | 0.30 |
| 58.5 | 46.0 | 23.3 | 33.76 | 63.82 | 0.58 |
| 64.2 | 47.2 | 23.8 | 33.54 | 64.42 | 0.60 |
| 53.2 | 46.0 | 23.9 | 33.90 | 63.36 | 0.56 |
| 53.3 | 46.0 | 24.2 | 34.05 | 63.75 | 0.60 |
| 57.7 | 48.5 | 24.4 | 34.16 | 64.78 | 0.68 |
| 57.4 | 48.6 | 26.1 | 34.73 | 66.31 | 0.79 |
| 61.0 | 47.2 | 26.9 | 34.86 | 67.49 | 0.85 |
| 61.1 | 47.1 | 27.2 | 34.94 | 67.78 | 0.86 |
| 54.9 | 45.5 | 27.4 | 35.06 | 66.86 | 0.82 |
| 61.1 | 45.6 | 28.2 | 35.15 | 68.49 | 0.89 |
| 61.1 | 46.1 | 28.6 | 35.23 | 68.81 | 0.90 |
| 57.0 | 46.1 | 28.6 | 35.33 | 68.18 | 0.88 |
| 59.2 | 47.2 | 29.3 | 35.39 | 69.00 | 0.90 |
| 56.5 | 43.8 | 30.1 | 35.50 | 68.90 | 0.90 |
| 61.4 | 44.9 | 30.7 | 35.46 | 70.06 | 0.93 |
| 61.2 | 46.1 | 31.6 | 35.49 | 70.45 | 0.93 |
| 56.5 | 44.5 | 31.7 | 35.59 | 69.62 | 0.92 |
| 57.9 | 44.5 | 31.9 | 35.59 | 70.02 | 0.93 |
| 65.0 | 48.6 | 32.3 | 35.04 | 70.80 | 0.93 |
| 60.0 | 46.5 | 32.8 | 35.49 | 70.70 | 0.94 |
| 67.1 | 44.5 | 34.0 | 34.85 | 71.54 | 0.94 |
| 60.8 | 47.2 | 34.9 | 35.20 | 71.17 | 0.94 |
| 66.8 | 44.7 | 35.7 | 34.64 | 71.91 | 0.94 |
| 67.1 | 44.5 | 36.2 | 34.51 | 71.95 | 0.94 |
| 67.2 | 44.4 | 36.7 | 34.39 | 71.99 | 0.93 |
| 66.9 | 44.4 | 37.3 | 34.26 | 72.00 | 0.93 |
| 67.2 | 44.4 | 37.3 | 34.22 | 72.00 | 0.92 |
Along the front, trimming sonication from about 32 to 21 minutes drops the chance of meeting both specifications from 0.93 to 0.18.
Explanation, details and sources
A Pareto search postpones the trade-off choice that desirability fixes in advance: it returns every condition that cannot improve one objective without losing another. Objectives: maximum TPC, maximum DPPH, minimum sonication time (a stated proxy for energy use and throughput, since the bath ran at a constant 110 W).
Accounting for model uncertainty shrinks the region that meets both specifications, and the cheapest conditions on the mean front often fail
Height and color show the probability. Amber marks conditions that meet both specifications with at least the required reliability.
Method, assumptions and limits
- What it calculates
- For each condition in the slice, the probability that a new run would give TPC and DPPH at or above the specifications, given the 16 published runs; the share of the slice meeting the specifications on mean predictions and with probability of at least R.
- Model
- Both responses share the quadratic design matrix X (16 × 10). Under the noninformative prior p(B, Σ) ∝ |Σ|−3/2, the predictive distribution of a new pair of responses is bivariate t with ν = 16 − 10 − 2 + 1 = 5 degrees of freedom, location B̂ᵀz(x) and scale (1 + h)S/ν, where S is the residual cross-product matrix and h the leverage. The residual correlation between TPC and DPPH is −0.80 and is kept.
- Monte Carlo
- 4,000 draws of (z1, z2, w) with z standard normal and w ~ χ²5, fixed seed, reused at every grid point (31 × 31) so the surface is smooth.
- Assumptions
- The quadratic model is correct; errors are normal, independent and of constant variance; no prior information. Significant lack of fit means the model is not fully correct, so these probabilities are optimistic in that respect.
- What it does not establish
- A design space in the regulatory sense. ICH Q8(R2) requires demonstration, which means confirmation runs at the chosen conditions and, for scale-up, evidence that the region holds at production scale. Dietary supplements have no design-space filing.
- References
- Peterson 2004 and 2008 (approach; full texts not accessed, abstracts verified); van de Berg et al. 2021 (a Monte Carlo probabilistic design space in a QbD study); ICH Q8(R2).
- Verification
- The Python reference evaluates the same probabilities with 10⁶ independent draws and checks the closed form against hierarchical sampling (inverse-Wishart covariance, matrix-normal coefficients); the three agree to within 0.001 at the authors' optimum.
Data table: share of the design sphere for four values of R
| R | Share of the design sphere |
|---|---|
| 0.50 | 13.1% |
| 0.80 | 5.9% |
| 0.90 | 2.1% |
| 0.95 | 0.0% |
At R = 0.80 the design space is 117 of 1,989 grid points (5.9% of the design sphere), and no condition reaches 0.95.
The shortest time that meets a specification on the mean meets it with well under even odds
Show data
| Specification (TPC, DPPH) | Shortest time on the mean | At ethanol, temperature | Probability of meeting both there | Probability at the authors' optimum (32.5 min) |
|---|---|---|---|---|
| ≥ 30 mg GAE/g, ≥ 60% | 20.2 min | 60.7%, 48.0 °C | 0.45 | 0.97 |
| ≥ 32 mg GAE/g, ≥ 62% | 21.7 min | 61.3%, 47.7 °C | 0.29 | 0.93 |
| ≥ 34 mg GAE/g, ≥ 65% | 24.2 min | 61.2%, 47.0 °C | 0.10 | 0.77 |
| ≥ 35 mg GAE/g, ≥ 68% | 27.5 min | 61.3%, 46.1 °C | 0.10 | 0.41 |
Computed by EUTECNIQ from the published models and data (grid search and SLSQP inside the design sphere; 10⁶ predictive draws per probability). Script: src/modules/designspace/compute/tradeoffs.py.
Explanation, details and sources
ICH Q8(R2) defines a design space as the combination of input variables and process parameters "that have been demonstrated to provide assurance of quality." Peterson proposed measuring that assurance as the posterior predictive probability that every response meets its specification, and accepting conditions where it exceeds a chosen reliability.
Models of one seed lot in one laboratory bath guide the next experiments but establish nothing about health or plant scale
- DPPH radical scavenging in a test tube≠an antioxidant effect in people
- High R2 on the design runs≠good prediction of new runs (predicted R2 0.58 for DPPH)
- Desirability optimum≠design space
- Model probability≠demonstrated assurance (confirmation runs are needed)
- Laboratory ultrasonic bath≠a plant-scale extractor
Text version of the proposed workflow
- ScreenFractional factorial or Plackett–Burman runs rank many candidate factors
- ModelBox–Behnken or central composite runs fit second-order models; lack of fit and predicted R2 reported
- Trade offDesirability for a fixed priority; NSGA-II with cost, solvent or time for an open choice
- Quantify riskPosterior probability of meeting every specification; region chosen at a stated reliability
- Confirm and scaleNew runs inside the region; scale-dependent parameters checked at pilot scale before transfer
Explanation, details and sources
The methods transfer to any botanical process; the numbers do not. A real program would repeat the design on qualified material, confirm the region with new runs and check it at pilot scale.
Related pages: QbD basics and a simulated response-surface example on process engineering and scale-up; QTPP, CQAs, CPPs and control strategy on QbD and control strategy; Gaussian-process and Bayesian optimization on botanical intelligence.
Plan a designed experiment on your material
Partners can describe a botanical process and its specifications; EUTECNIQ would propose a design, the analyses it supports and what it would not establish.