

Five equations show which input controls each process step, and where each stops working
Each calculator solves a cited equation in your browser, states its valid range and passes independent reference checks. Inputs are teaching examples; outputs are not EUTECNIQ measurements and establish nothing about any product.
Each model isolates one lever, so it can guide an experiment but cannot replace one
Data table: the marked points
| Chart | Input | Output |
|---|---|---|
| Extraction | 0.86 mm; 0.43 mm | 25 min; 6.3 min to 90% |
| Emulsion creaming | one day, oil 945 kg/m³ | crossover 407 nm (about 110 nm over two years) |
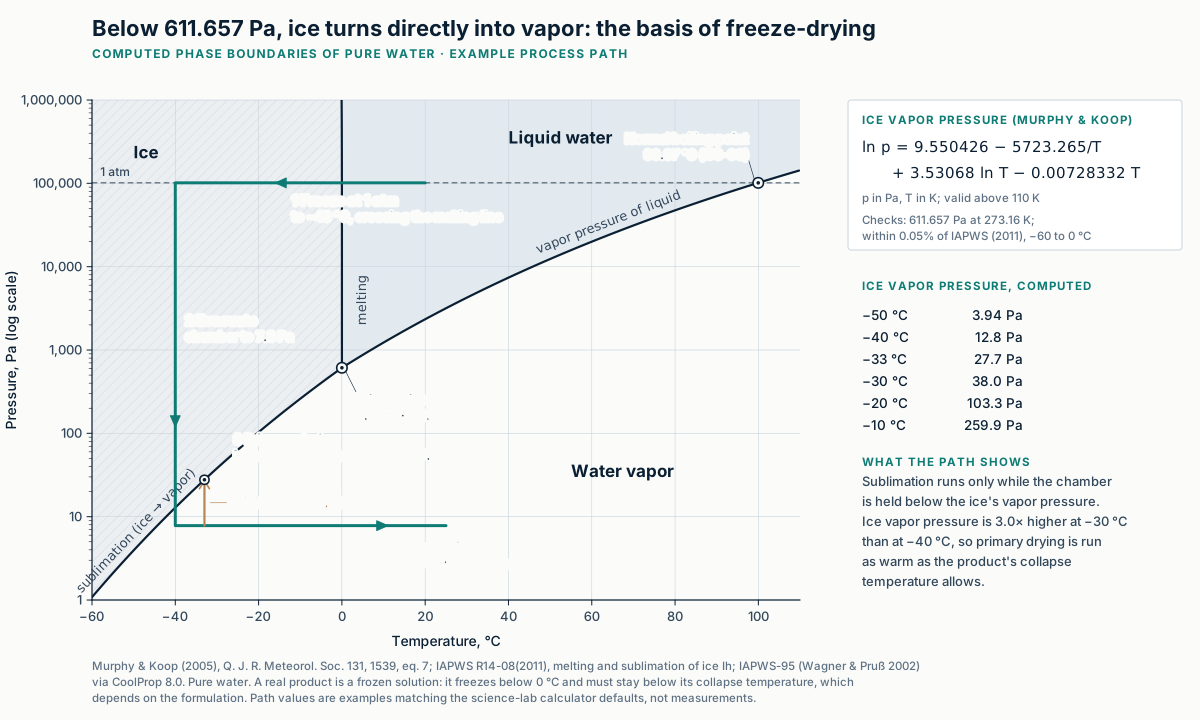
| Freeze-drying | −33 °C product; −30 vs −20 °C | pice 27.7 Pa; ratio 2.72 |
| Accelerated stability | Ea 63, 83, 103 kJ/mol | 20.3, 29.8, 43.9 months at 25 °C |
| Chromatography | N 8,000: α 1.06, 1.12; N 30,000: α 1.06 | Rs 1.01, 1.92; 1.96 |
Status. These are educational simulations written for this website. EUTECNIQ Sciences is a company in formation; it has no laboratory or experimental data yet, and none of the numbers below are its results.
Show the table (5 rows): what each model can and cannot establish
| Calculator | Main lever in the model | Useful for | Does not establish |
|---|---|---|---|
| Extraction kinetics | Particle size: the time to 90% extraction scales with the diameter squared | Choosing a milling target before extraction trials | Yield, purity or selectivity of a real extract |
| Emulsion creaming | Droplet diameter, density difference and continuous-phase viscosity | Setting a droplet-size target for a dispersion | Shelf life, coalescence, Ostwald ripening or bioavailability |
| Freeze-drying | Ice vapor pressure at the product temperature versus chamber pressure; collapse temperature | Checking whether an operating point can sublime ice without collapse | A drying cycle: heat and mass transfer are not modeled |
| Accelerated stability | Activation energy of a single first-order degradation pathway | Planning stability studies and pull points | A validated shelf life or an expiration date |
| Chromatographic resolution | Selectivity α ahead of plate count N | Deciding where method-development effort goes | A validated method (ICH Q2(R2)) or the identity of a peak |
Explanation, details and sources
Use the calculators to see which variable dominates before a study is designed. Every model leaves out effects that real materials show; the methods panel under each calculator lists them, with its equations, units and valid range. In the stability chart, a ±20 kJ/mol uncertainty in activation energy moves the 25 °C prediction from about 20 to 44 months, and ICH Q1E assigns drug shelf life from long-term data, with only limited extrapolation.
Each calculator draws its chart and readouts from one cited equation, and warns outside its valid range
Extraction: halving the particle diameter cuts the time to 90% extraction fourfold
Solute diffuses out of each plant particle into the solvent.
Explanation, details and sources
For a sphere in a well-mixed solvent, the time to reach any given fraction scales with the radius squared divided by the effective diffusivity, Deff.
τ = Deff tR2 t90 = 0.18299 R2Deff
Assumptions
- Uniform spheres with uniform initial solute and constant Deff
- Perfect sink: well-mixed solvent, no solubility limit, no external film resistance
- Real plant material has size distributions, broken cells and wash-out, so Deff is fitted to data
Method, assumptions and limits
- What it calculates
- The fraction of the extractable solute that has left a spherical particle after time t, the time to reach 90%, and the radial concentration profile shown in the cross-section.
- Equations
- Released fraction Mt/M∞ = 1 − (6/π²) Σ (1/n²) exp(−n²π²τ) with τ = Defft/R². For τ < 0.01 the equivalent short-time form 6(τ/π)1/2 − 3τ is used (the neglected terms are below 10−40). Concentration C/C0 = (2/πρ) Σ ((−1)n+1/n) sin(nπρ) exp(−n²π²τ), ρ = r/R. τ90 = 0.18299 is found by bisection on the series.
- Variables and units
- d particle diameter, 0.1–5 mm on a logarithmic slider; R = d/2; Deff effective diffusivity inside the particle, 10−12–10−9 m²/s on a logarithmic slider; t time in s (displayed in convenient units).
- Assumptions
- Fickian diffusion in a non-swelling sphere; uniform initial concentration; all solute extractable; surface concentration held at zero by a large, well-mixed solvent volume.
- Valid range
- Diffusion-controlled extraction where external mass transfer is fast. Very short computed times signal that mixing or external film transfer, which the model ignores, would control the rate; a warning appears below 10 s. Plant material often shows a fast washing phase from broken cells before slow diffusion, which a single Deff cannot describe.
- Does not establish
- Yield, purity, selectivity, solvent choice, thermal degradation or the performance of any EUTECNIQ process. No EUTECNIQ data are used.
- References
- Crank J. The Mathematics of Diffusion, 2nd ed. Clarendon Press; 1975, chapter 6.
- Verification
- Node unit tests compare the series with a 20,000-term numpy evaluation (agreement better than 10−9), check that the two branches agree at τ = 0.01, and check mass balance between the concentration profile and the released fraction. Browser readouts are compared with an independent Python reference (scipy root finding) within display rounding.
Emulsions: over one day, droplets below about 400 nm move more by Brownian motion than by creaming; over two years the crossover falls to about 110 nm
Stokes' law gives how fast a droplet rises or settles.
Explanation, details and sources
The Stokes–Einstein relation gives how far Brownian motion moves it. Creaming distance grows with time and Brownian displacement with its square root, so the crossover diameter falls as the time window lengthens. This addresses creaming only.
xrms = √(2Dt) crossover: v t = xrms
Assumptions
- Continuous phase is water at 25 °C (997.05 kg/m³); thickening changes viscosity only
- Dilute, non-interacting rigid spheres of one size
- Ignores flocculation, coalescence, Ostwald ripening and oxidation
- Small droplets disperse a poorly soluble active; they do not dissolve it, and dispersion is not bioavailability
Data table
| T (°C) | Density (kg/m³) | Viscosity (mPa·s) |
|---|---|---|
| 5 | 999.97 | 1.5182 |
| 10 | 999.70 | 1.3059 |
| 15 | 999.10 | 1.1376 |
| 20 | 998.21 | 1.0016 |
| 25 | 997.05 | 0.8900 |
| 30 | 995.65 | 0.7972 |
| 35 | 994.03 | 0.7191 |
| 40 | 992.22 | 0.6527 |
| 45 | 990.21 | 0.5958 |
| 50 | 988.04 | 0.5465 |
| 55 | 985.69 | 0.5036 |
| 60 | 983.20 | 0.4660 |
| 65 | 980.55 | 0.4329 |
| 70 | 977.76 | 0.4036 |
| 75 | 974.84 | 0.3774 |
| 80 | 971.79 | 0.3540 |
Method, assumptions and limits
- What it calculates
- The creaming (or settling) velocity of a droplet, the distance it would move under gravity over the chosen time window, its one-dimensional root-mean-square Brownian displacement over the same window, and the droplet diameter at which the two are equal.
- Equations
- v = d²|Δρ|g/(18η) (Stokes); D = kBT/(3πηd) (Stokes–Einstein); xrms = (2Dt)1/2. Setting vt = xrms gives the crossover diameter d* = [216 kBTη / (π Δρ² g² t)]1/5, so d* falls as t−1/5.
- Variables and units
- d droplet diameter, 20 nm–20 µm (logarithmic); oil density 880–1,050 kg/m³; Δρ = ρoil − 997.05 kg/m³; η continuous-phase viscosity, 0.890–100 mPa·s (logarithmic; 0.890 mPa·s is water at 25 °C); t from one hour to two years.
- Assumptions
- Rigid spheres at low Reynolds number in an unbounded, quiescent, Newtonian liquid; no interactions between droplets; constant size. Thickeners are represented only by their Newtonian viscosity; many hydrocolloids are shear-thinning or have a yield stress, which this model does not capture.
- Valid range
- Reynolds numbers stay far below 0.1 across the slider range, so Stokes drag applies. Creaming distances longer than the container height mean the droplets would already have reached the top; a warning appears above 10 cm. Concentrated emulsions cream more slowly than Stokes predicts because droplets hinder each other.
- Does not establish
- Physical shelf life, which also depends on coalescence and Ostwald ripening; chemical stability; or absorption in the body. A nanoemulsion is thermodynamically unstable and only kinetically stabilized, unlike a microemulsion (McClements 2012).
- References
- Stokes 1851; Einstein 1905; McClements 2012; Wagner & Pruß 2002 (IAPWS-95 density); Huber et al. 2009 (IAPWS 2008 viscosity).
- Verification
- Unit tests check the velocity and diffusivity against values computed with scipy.constants and confirm that the crossover diameter makes the two distances equal. Browser readouts match the Python reference within display rounding.
Freeze-drying: ice sublimes only while the chamber pressure is below its vapor pressure, and the product must stay below its collapse temperature
The vapor pressure of ice is a measured property of water.
Explanation, details and sources
The operating point sets the driving force for drying; the collapse temperature, a property of each formulation, sets how warm the product may become.
Assumptions
- Collapse temperature is formulation-specific and measured, for example by freeze-drying microscopy; the default is only an example
- Real product temperature results from heat and mass transfer through the shelf, vial and dried layer; here it is set directly
- Chamber gas is taken as water vapor, so the chamber pressure approximates its partial pressure
Method, assumptions and limits
- What it calculates
- The equilibrium vapor pressure of ice at the chosen product temperature, the difference between that pressure and the chamber pressure, and the margin between the product temperature and an example collapse temperature.
- Equations
- ln pice = 9.550426 − 5723.265/T + 3.53068 ln T − 0.00728332 T, with T in K and p in Pa. 1 Pa = 7.50062 mTorr. Margin to collapse = Tc − Tp.
- Variables and units
- Tp product temperature at the sublimation front, −55 to −5 °C; Pc chamber pressure, 2–60 Pa (logarithmic); Tc collapse temperature, −50 to −5 °C.
- Assumptions
- Ice Ih at equilibrium with its vapor; chamber gas is essentially water vapor. The pressure difference indicates the direction of mass transfer, not its rate, which also depends on dried-layer and vial resistance.
- Valid range
- The Murphy & Koop equation is valid above 110 K; over this slider range it agrees with the IAPWS 2011 sublimation equation to within 0.05%. Outside 110–273.16 K the calculator returns no value.
- Does not establish
- A drying cycle, drying time, shelf temperature, residual moisture or product quality. Cycle design keeps the product below its collapse temperature with a margin chosen for the formulation and equipment (Tang & Pikal 2004).
- References
- Murphy & Koop 2005; Wagner et al. 2011 (IAPWS); Tang & Pikal 2004.
- Verification
- Unit tests reproduce the triple point (611.657 Pa at 273.16 K) and agree with an independent implementation of the IAPWS 2011 sublimation equation within 0.06% from 200 to 268 K. Browser readouts match the Python reference within display rounding.
Stability: accelerated data predict shelf life only if one degradation mechanism holds across temperatures
Arrhenius kinetics translate a degradation rate measured at 40 °C into rates at 25 °C and 30 °C.
Explanation, details and sources
The prediction helps plan a study. For drugs, ICH Q1E assigns shelf life from long-term data, with only limited extrapolation; dietary supplements are not bound by ICH but face the same science.
t90 = ln(1/0.9)k AF = k40k25
Assumptions
- One first-order mechanism with the same Ea at every temperature; humidity effects ignored
- Storage conditions follow ICH Q1A(R2): long-term 25 °C/60% RH or 30 °C/65% RH, accelerated 40 °C/75% RH
- 90% of the initial assay is used as an example specification limit
- Physical changes such as caking, emulsion breakdown or color are not captured
Method, assumptions and limits
- What it calculates
- The first-order rate constant implied by a measured time to 90% assay at 40 °C, its value at 25 °C and 30 °C under the Arrhenius equation, and the resulting predicted times to 90%.
- Equations
- k40 = ln(1/0.9)/t90,40; k(T)/k40 = exp[−(Ea/R)(1/T − 1/313.15 K)]; t90(T) = ln(1/0.9)/k(T); remaining assay = 100% × exp(−kt).
- Variables and units
- Ea activation energy, 40–150 kJ/mol; t90,40 measured time to 90% at 40 °C, 1–24 months; temperatures converted to K by adding 273.15.
- Assumptions
- A single degradation pathway with first-order kinetics and a temperature-independent activation energy; no change of mechanism, phase or water activity between 25 and 40 °C. The default Ea of 83 kJ/mol is an example only; it must be measured for each product.
- Valid range
- Interpolation and short extrapolation of chemical degradation in a stable matrix. Under ICH Q1A(R2), a 5% change in assay from the initial value is a "significant change" for a drug product; when it occurs at the accelerated condition, ICH Q1E bases shelf life on long-term and intermediate data. A warning appears when the input implies that.
- Does not establish
- A validated shelf life or an expiration date. ICH Q1E limits extrapolation beyond long-term data (for room-temperature products with little change, up to twice the period covered, and not more than 12 months beyond it) and requires confirmation with real-time data. A consolidated revision of ICH Q1 reached Step 2 in April 2025; ICH's March 2026 work plan targeted Step 4 adoption for November 2026.
- References
- Arrhenius 1889; ICH Q1A(R2) (FDA, November 2003); ICH Q1E (FDA, June 2004); ICH Q1 Expert Working Group work plan (March 2026).
- Verification
- Unit tests reproduce acceleration factors computed with scipy.constants (4.972 for 40 → 25 °C at 83 kJ/mol). Browser readouts match the Python reference within display rounding.
Chromatography: selectivity moves resolution far more than plate count, which is why method development starts there
Two closely related markers, such as a flavonol glycoside and a spiked aglycone, must be separated before either can be measured.
Explanation, details and sources
Wohlmuth et al. (2014) found evidence of flavonol aglycone adulteration in 3 of 8 ginkgo products and showed that pharmacopoeial assays, which measure aglycones after hydrolysis, cannot detect it. The Purnell equation shows which lever matters.
Assumptions
- Gaussian peaks of equal area; dead time 1.0 min; both peaks share N
- Rs ≥ 1.5 is the usual criterion for baseline resolution of equal peaks
- Botanical extracts contain many co-eluting compounds; mass spectrometry adds a second dimension of selectivity
Drag to rotate or use the buttons; move the plate-number slider above to raise or lower the whole surface.
Method, assumptions and limits
- What it calculates
- The resolution of two adjacent peaks from plate count, selectivity and retention, the plate count needed to reach Rs = 1.5, and a simulated chromatogram.
- Equations
- Rs = (√N/4)((α − 1)/α)(k2/(1 + k2)); Nreq = [4Rs α(1 + k2)/((α − 1)k2)]². Peaks: k1 = k2/α, ti = t0(1 + ki), σi = ti/√N.
- Variables and units
- N theoretical plates, 1,000–30,000; α = k2/k1, 1.00–1.30; k2 retention factor of the later peak, 0.5–15; t0 = 1.0 min; times in minutes.
- Assumptions
- Isocratic, Gaussian peaks of equal size; the Purnell form takes both peak widths equal to the second, so it slightly underestimates the resolution of the drawn peaks (by at most about 12% across this range).
- Valid range
- Retention factors between about 1 and 10 are usually targeted in method development; outside that range the calculator warns. At α = 1 no plate count separates the peaks.
- Does not establish
- A validated analytical procedure (specificity, accuracy, precision, range and robustness under ICH Q2(R2)), the identity of a peak, or the absence of co-eluting compounds.
- References
- Purnell 1960; Snyder, Kirkland & Dolan 2010; Wohlmuth et al. 2014.
- Verification
- Unit tests confirm Rs = 1.0126 for N = 8,000, α = 1.06, k2 = 4, the inverse relation for Nreq, and the bound between the Purnell value and the drawn peaks. Browser readouts match the Python reference within display rounding.
Explanation, details and sources
Charts and readouts are computed from the same function, so they always agree. Out-of-range or physically questionable settings produce a plain-language warning instead of a number that looks precise.
Need a model checked against your data?
EUTECNIQ proposes to fit and validate process models like these against measured data for partners, with the assumptions and uncertainty stated.