

Standards set the rules; Six Sigma statistics show whether a process keeps them
Which quality rulebooks would apply to a botanical ingredient plant, what each covers, and the statistics that turn specifications into measured control: SPC, capability, gauge R&R and designed experiments.
Status. EUTECNIQ has no laboratory, data, certification or accreditation. Charts use published data or labeled simulations.
Two FDA rules are law; every other quality standard on this map is voluntary
Data table: every element on the map
| Kind of authority | Rulebook (edition) | Element |
|---|---|---|
| U.S. law (FDA) | 21 CFR 111, dietary supplement CGMP | Specifications (Subpart E) |
| U.S. law (FDA) | 21 CFR 111, dietary supplement CGMP | Quality control (Subpart F) |
| U.S. law (FDA) | 21 CFR 111, dietary supplement CGMP | Master and batch records (Subparts H, I) |
| U.S. law (FDA) | 21 CFR 111, dietary supplement CGMP | Laboratory operations (Subpart J) |
| U.S. law (FDA) | 21 CFR 111, dietary supplement CGMP | Complaints and returns (Subparts N, O) |
| U.S. law (FDA) | 21 CFR 117, human food CGMP and preventive controls | CGMP (Subpart B) |
| U.S. law (FDA) | 21 CFR 117, human food CGMP and preventive controls | Hazard analysis and risk-based preventive controls (Subpart C) |
| U.S. law (FDA) | 21 CFR 117, human food CGMP and preventive controls | Supply-chain program (Subpart G) |
| U.S. law (FDA) | 21 CFR 117, human food CGMP and preventive controls | Records (Subpart F) |
| Certification | ISO 9001:2026, quality management systems (edition 6) | Quality management requirements for any organization |
| Certification | ISO 9001:2026, quality management systems (edition 6) | Internal audit and management review |
| Certification | ISO 22000:2018, food safety management systems | HACCP principles (Codex) |
| Certification | ISO 22000:2018, food safety management systems | Prerequisite programmes |
| Certification | ISO 22000:2018, food safety management systems | Interactive communication |
| Certification | FSSC 22000 (version 6; version 7 published May 7, 2026) | ISO 22000 |
| Certification | FSSC 22000 (version 6; version 7 published May 7, 2026) | Sector prerequisite programmes (ISO/TS 22002-x; ISO 22002-x:2025 in v7) |
| Certification | FSSC 22000 (version 6; version 7 published May 7, 2026) | FSSC additional requirements |
| Certification | SQF Food Safety Code: Dietary Supplement Manufacturing, Edition 10 | SQF System Elements (Module 2) |
| Certification | SQF Food Safety Code: Dietary Supplement Manufacturing, Edition 10 | Food safety plan under Codex HACCP (element 2.4.3) |
| Certification | SQF Food Safety Code: Dietary Supplement Manufacturing, Edition 10 | Good industry practice module |
| Accreditation | ISO/IEC 17025:2017, testing and calibration laboratories | Impartiality and confidentiality (clause 4) |
| Accreditation | ISO/IEC 17025:2017, testing and calibration laboratories | Personnel, facilities, equipment, traceability (clause 6) |
| Accreditation | ISO/IEC 17025:2017, testing and calibration laboratories | Methods, measurement uncertainty, validity of results (clause 7) |
| Accreditation | ISO/IEC 17025:2017, testing and calibration laboratories | Management system (clause 8) |
| ICH guidance (drug) | ICH Q8(R2), pharmaceutical development (2009) | Target profile, critical quality attributes, design space |
| ICH guidance (drug) | ICH Q9(R1), quality risk management (2023) | Risk assessment, control, communication and review |
| ICH guidance (drug) | ICH Q10, pharmaceutical quality system (2008) | Management review and continual improvement |
| Statistical method standards | ISO 13053-1 and -2:2011, Six Sigma (confirmed 2022) | DMAIC methodology (part 1) |
| Statistical method standards | ISO 13053-1 and -2:2011, Six Sigma (confirmed 2022) | Tools and techniques (part 2) |
| Statistical method standards | ISO 7870-2:2023, Shewhart control charts | Control limits and patterns |
| Statistical method standards | AIAG Measurement Systems Analysis, 4th edition (2010) | %GRR and number-of-distinct-categories guidelines |
| Statistical method standards | AIAG and VDA FMEA Handbook, 1st edition (2019) | Seven steps and action priority |
FDA's Parts 111 and 117 bind; certificates, accreditation, ICH guidance and the statistical standards are chosen by the firm or required by customers.
No single certificate covers law, food safety, laboratory competence and management review
A plant making both bulk extracts and finished supplements would answer to Part 117 and Part 111 at once; certificates add evidence, not legal compliance.
Explanation, details and sources
| Rulebook | Kind | Checked by | Edition in force, Oct 24, 2026 | Does not cover |
|---|---|---|---|---|
| 21 CFR Part 111 | Regulation (final) | FDA investigators | eCFR current to Oct 22, 2026; final rule 72 FR 34752 (2007) | Dietary-ingredient-only operations whose customers further process the ingredient (FDA SECG); drug manufacturing |
| 21 CFR Part 117 | Regulation (final) | FDA investigators | eCFR current to Oct 22, 2026; final rule 80 FR 55908 (2015) | Subparts C and G do not apply to supplement operations that comply with Part 111 (§ 117.5(e)) |
| ISO 9001:2026 | Voluntary standard | Accredited certification bodies (ISO does not certify) | Edition 6, published Sep 16, 2026; replaced ISO 9001:2015 | Food-safety hazard analysis; laboratory competence |
| ISO 22000:2018 | Voluntary standard | Certification bodies; certification is optional | Edition 2; confirmed 2023; a revision (ISO/DIS 22000) is under development | GFSI recognition on its own; laboratory competence |
| FSSC 22000 | Certification scheme | Licensed certification bodies | Version 6 (mandatory since Apr 1, 2024); Version 7 published May 7, 2026, all audits to v7 from May 1, 2027 (UKAS) | U.S. legal compliance |
| SQF | Certification scheme | SQF certification bodies | Edition 10 released March 2026; audits anticipated from Jan 1, 2027 (SGS); code "Food Safety Code: Dietary Supplement Manufacturing" (FSC 31) | U.S. legal compliance |
| ISO/IEC 17025:2017 | Voluntary standard | Accreditation bodies (ILAC MRA signatories accredit testing labs to it) | Edition 3; confirmed 2023 | Manufacturing GMP; product release |
| ICH Q8(R2), Q9(R1), Q10 | Drug guidance | Drug regulators; no authority over supplements | Q8(R2) Aug 2009; Q9(R1) Jan 18, 2023; Q10 Jun 4, 2008 | Dietary supplements as a legal requirement |
Parts 111 and 117 require specifications, verification and records, not a particular statistical method. The only statistical tool Part 111 names is a "sound statistical sampling plan" for choosing which finished batches to test (§§ 111.75(c), 111.80(c)); Part 117 names none. The statistics below are one disciplined way to meet these rules.
Specifications and production records drew 57% of FDA's 1,938 Part 111 citations in fiscal 2025
Data table: sections and citations by subpart
| Subpart | Title (eCFR) | Sections | Share of 84 | Citations | Share of 1,938 | Citation types |
|---|---|---|---|---|---|---|
| E | Requirement to Establish a Production and Process Control System | 12 | 14.3% | 759 | 39.2% | 33 |
| F | Production and Process Control System: Requirements for Quality Control | 11 | 13.1% | 216 | 11.1% | 41 |
| H | Production and Process Control System: Requirements for the Master Manufacturing Record | 2 | 2.4% | 188 | 9.7% | 5 |
| I | Production and Process Control System: Requirements for the Batch Production Record | 2 | 2.4% | 163 | 8.4% | 5 |
| J | Production and Process Control System: Requirements for Laboratory Operations | 5 | 6.0% | 77 | 4.0% | 10 |
| D | Equipment and Utensils | 4 | 4.8% | 75 | 3.9% | 13 |
| M | Holding and Distributing | 6 | 7.1% | 72 | 3.7% | 7 |
| C | Physical Plant and Grounds | 4 | 4.8% | 67 | 3.5% | 19 |
| O | Product Complaints | 3 | 3.6% | 66 | 3.4% | 7 |
| N | Returned Dietary Supplements | 7 | 8.3% | 65 | 3.4% | 4 |
| B | Personnel | 5 | 6.0% | 53 | 2.7% | 8 |
| K | Production and Process Control System: Requirements for Manufacturing Operations | 6 | 7.1% | 49 | 2.5% | 9 |
| G | Production and Process Control System: Requirements for Components, Packaging, and Labels and for Product That You Receive for Packaging or Labeling as a Dietary Supplement | 6 | 7.1% | 43 | 2.2% | 17 |
| L | Production and Process Control System: Requirements for Packaging and Labeling Operations | 6 | 7.1% | 37 | 1.9% | 9 |
| P | Records and Recordkeeping | 2 | 2.4% | 8 | 0.4% | 2 |
| A | General Provisions | 3 | 3.6% | 0 | 0.0% | 0 |
Subpart E holds 14% of Part 111's sections and drew 39% of the citations; writing measurable specifications comes before any statistics.
Explanation, details and sources
Five years of the same data, by subpart and section, are on Quality system; a market view is on Competitive landscape. Record, audit-trail and traceability controls, the other half of the records problem, are on Digital lab.
DMAIC orders the work: define what matters, prove the measurement, then improve and hold the gain
The operational excellence library works DMAIC end to end on one example; this page supplies the statistics each phase needs.
A critical-to-quality tree turns "what the label says" into ten measurable characteristics
Variables earn capability indices; pass-or-fail attributes earn defect rates. Either way, the specification limit comes first.
A gauge R&R study splits observed variation into the parts and the measurement system
Data table: the 90 published measurements (°C/W)
| Part | Op 1 t1 | Op 1 t2 | Op 1 t3 | Op 2 t1 | Op 2 t2 | Op 2 t3 | Op 3 t1 | Op 3 t2 | Op 3 t3 |
|---|---|---|---|---|---|---|---|---|---|
| 1 | 37 | 38 | 37 | 41 | 41 | 40 | 41 | 42 | 41 |
| 2 | 42 | 41 | 43 | 42 | 42 | 42 | 43 | 42 | 43 |
| 3 | 30 | 31 | 31 | 31 | 31 | 31 | 29 | 30 | 28 |
| 4 | 42 | 43 | 42 | 43 | 43 | 43 | 42 | 42 | 42 |
| 5 | 28 | 30 | 29 | 29 | 30 | 29 | 31 | 29 | 29 |
| 6 | 42 | 42 | 43 | 45 | 45 | 45 | 44 | 46 | 45 |
| 7 | 25 | 26 | 27 | 28 | 28 | 30 | 29 | 27 | 27 |
| 8 | 40 | 40 | 40 | 43 | 42 | 42 | 43 | 43 | 41 |
| 9 | 25 | 25 | 25 | 27 | 29 | 28 | 26 | 26 | 26 |
| 10 | 35 | 34 | 34 | 35 | 35 | 34 | 35 | 34 | 35 |
| Source | DF | SS | MS | F |
|---|---|---|---|---|
| Parts | 9 | 3,935.96 | 437.33 | 162.27 |
| Operators | 2 | 39.27 | 19.63 | 7.28 |
| Parts × operators | 18 | 48.51 | 2.70 | 5.27 |
| Repeatability (error) | 60 | 30.67 | 0.51 | |
| Total | 89 | 4,054.40 |
Method, assumptions and limits
- What it calculates
- A crossed two-way random-effects ANOVA gauge study: variance components for parts, operators, the part-by-operator interaction and repeatability; %GRR of study variation, %Contribution, %Tolerance and the number of distinct categories. The what-if mode computes the same metrics directly from standard deviations you enter.
- Equations
- σ²E = MSE; σ²PO = (MSPO − MSE)/r; σ²O = (MSO − MSPO)/(p·r); σ²P = (MSP − MSPO)/(o·r); negative estimates are set to zero. σ²GRR = σ²E + σ²O + σ²PO. %GRR = 100·σGRR/σtotal; %Contribution = 100·σ²GRR/σ²total; %Tolerance = 100·6σGRR/(USL − LSL); ndc = 1.41·σP/σGRR, truncated (minimum 1). When the interaction p-value exceeds 0.05 (Minitab's default "alpha to remove interaction"), the interaction is pooled into repeatability.
- Variables and units
- p = 10 parts, o = 1–3 operators, r = 3 trials; thermal performance in °C per watt.
- Acceptance guidance
- AIAG MSA 4th edition (2010), as quoted by Minitab: %GRR below 10% acceptable; 10–30% acceptable depending on the application, cost of the device, cost of repair and other factors; above 30% not acceptable; ndc should be 5 or more. These are guidelines, not regulatory limits.
- Valid range
- Balanced crossed designs only. At least two operators must stay selected. What-if inputs are clamped to the slider ranges.
- Does not establish
- Bias, linearity or stability of the gauge; the adequacy of any EUTECNIQ method; or analytical method validation under ICH Q2(R2) or USP, which is a separate exercise.
- References
- SAS/STAT 14.1 PROC VARCOMP Example 121.2; Houf and Berman 1988; Burdick, Borror and Montgomery 2003; Minitab support: "Is my measurement system acceptable?", number of distinct categories, default settings.
- Verification
- Reproduces every sum of squares, mean square and variance component printed by SAS (e.g., Var(part) 48.29259, Var(operator) 0.56461, Var(interaction) 0.72798, Var(error) 0.51111, PTR 0.20145). Independent reference: tests/numerics/ref/qual_quality-six-sigma.py.
In the published study, measurement took 19% of the study variation and ndc is 7: inside AIAG's "may be acceptable" band.
A control chart separates routine variation from a real change
Rule numbers used on the chart
| Number | Signal |
|---|---|
| 1 | One point beyond 3σ of the plotted statistic |
| 2 | Two of the last three beyond 2σ, same side |
| 3 | Four of the last five beyond 1σ, same side |
| 4 | Eight in a row on one side of the centre line |
| 5 | Six in a row steadily rising or falling |
Data table: average run length by shift
| Shift (σ) | 3σ rule only | + rules 2–4 | + rules 2–5 |
|---|---|---|---|
| 0 | 370.4 | 91.7 | 78.3 |
| 0.25 | 281.1 | 57.5 | 52.0 |
| 0.5 | 155.2 | 27.5 | 26.6 |
| 0.75 | 81.2 | 14.7 | 14.5 |
| 1 | 43.9 | 9.3 | 9.2 |
| 1.25 | 25.0 | 6.5 | 6.5 |
| 1.5 | 15.0 | 4.9 | 4.8 |
| 2 | 6.3 | 3.1 | 3.1 |
| 2.5 | 3.2 | 2.2 | 2.2 |
| 3 | 2.0 | 1.7 | 1.7 |
Run rules catch a 1σ shift after about 9 points instead of 44, at the price of a false alarm every 92 points instead of 370.
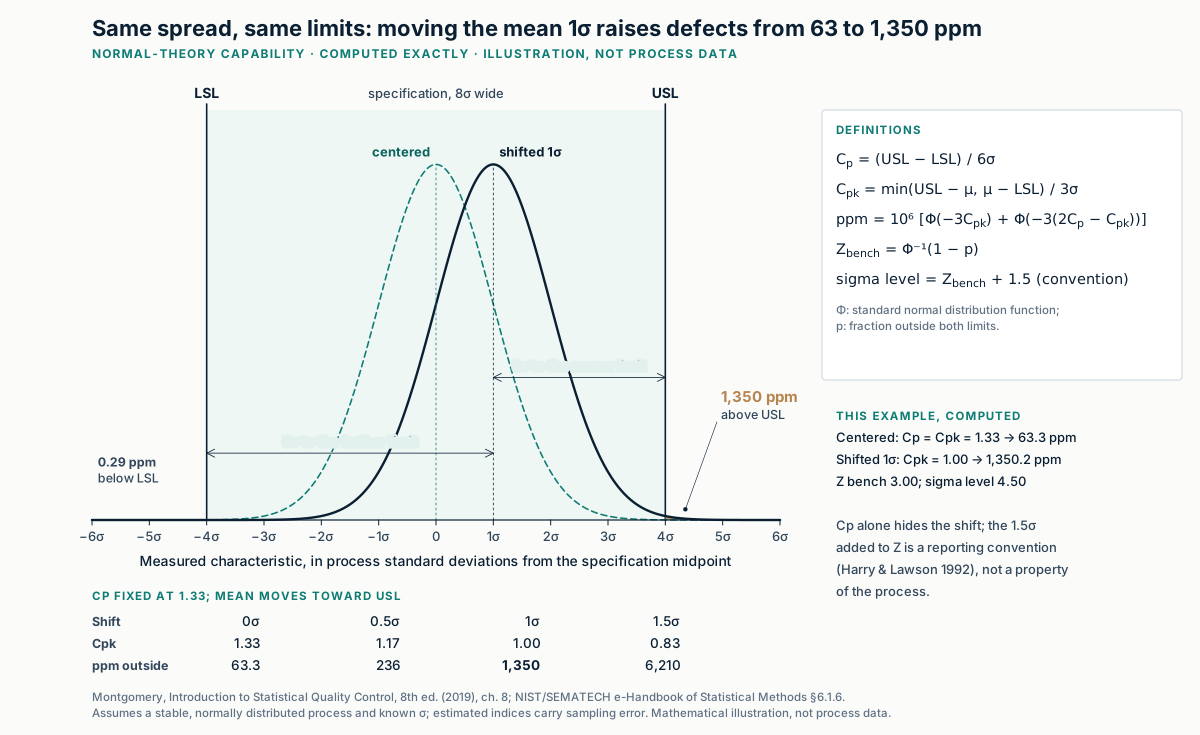
Cp and Cpk together fix the expected defect rate; the sigma level adds a 1.5σ convention
Reference values (NIST §6.1.6, centered process)
| Cp = Cpk | USL − LSL | Rejects (NIST) | This calculator |
|---|---|---|---|
| 1.00 | 6σ | 0.27% | 2,700 ppm |
| 1.33 | 8σ | 64 ppm | 63 ppm (Cp = 4/3) |
| 1.66 | 10σ | 0.6 ppm | 0.57 ppm (Cp = 5/3) |
| 2.00 | 12σ | 2 ppb | 0.002 ppm |
Method, assumptions and limits
- What it calculates
- For a normal process with a two-sided specification, the expected fraction outside the limits from Cp and Cpk, the benchmark Z, the sigma level under the 1.5σ convention, and the indices that would be observed if measurement error adds to process variation.
- Equations
- The nearer limit lies 3Cpk standard deviations from the mean and the farther limit 3(2Cp − Cpk). ppm = 106[Φ(−3Cpk) + Φ(−3(2Cp − Cpk))]. Zbench = Φ−1(1 − p). Sigma level (convention) = Zbench + 1.5. With σ2observed = σ2process + σ2measurement, observed Cp = Cp/√(1 + g2), g = σm/σp; Cpk scales the same way when the gauge is unbiased.
- Valid range
- 0.5 ≤ Cp ≤ 2.5; Cpk is held at or below Cp (a larger value is impossible). Normality and statistical control are assumed; skewed data (for example, contaminant results near a detection limit) need other methods.
- The 1.5σ convention
- Six Sigma tables add 1.5σ to the long-term Z so that "6σ" corresponds to 3.4 defects per million. It is a convention from Motorola's practice, not a law of nature; EUTECNIQ would report measured within- and between-lot variation instead.
- Does not establish
- The capability of any real process, the stability of a process, or its shelf life. Capability from real data, with confidence intervals, is in the operational excellence library.
- Verification
- Reproduces the NIST table of rejects against Cp; independent reference: tests/numerics/ref/qual_quality-six-sigma.py.
A centered Cpk of 1.33 means about 63 ppm outside specification (NIST: 64 ppm); measurement error lowers the observed index.
A two-level factorial ranks seven effects from eight runs
Data table: NIST eddy current probe study (23 full factorial)
| Run (standard order) | X1 turns (90 / 180) | X2 distance (0.38 / 1.14) | X3 gauge (40 / 48) | Impedance (ohms) |
|---|---|---|---|---|
| 1 | − | − | − | 1.70 |
| 2 | + | − | − | 4.57 |
| 3 | − | + | − | 0.55 |
| 4 | + | + | − | 3.39 |
| 5 | − | − | + | 1.51 |
| 6 | + | − | + | 4.59 |
| 7 | − | + | + | 0.67 |
| 8 | + | + | + | 4.29 |
| Term | Coefficient |
|---|---|
| Mean | 2.65875 |
| X1 | 1.55125 |
| X2 | −0.43375 |
| X3 | 0.10625 |
| X1·X2 | 0.06375 |
| X1·X3 | 0.12375 |
| X2·X3 | 0.14875 |
| X1·X2·X3 | 0.07125 |
Method, assumptions and limits
- What it calculates
- Least-squares coefficients of the 23 full factorial (orthogonal, so each coefficient is the same whichever terms are kept), predictions at the eight corners, and the residual standard deviation of the chosen model.
- Equations
- bt = (1/8) Σ xt,i yi with x = ±1; residual SD = √(Σ(y − ŷ)2/(8 − 1 − k)) for k terms.
- Why this dataset
- It is a public, fully documented two-level factorial with published coefficients, so every number can be checked. The method transfers directly to extraction or drying factors (for example solvent ratio, temperature, time); this page does not claim results for any botanical process.
- Valid range
- Predictions inside the cube only; a two-level design cannot detect curvature, which needs centre points or a response-surface design.
- Verification
- Matches NIST's coefficients and its residual standard deviations for each nested model (1.74106, 0.57272, 0.30429, 0.26737, 0.23341, 0.19121, 0.18031 ohms). Independent reference: tests/numerics/ref/qual_quality-six-sigma.py.
Two main effects carry the study: adding X1 and X2 cuts the residual SD from 1.74 to 0.30 ohms (NIST).
Explanation, details and sources
A factorial study at laboratory scale finds which factors matter; carrying the chosen settings to pilot and commercial scale, and validating the process there, is covered on Scale-up and tech transfer.
FMEA ranks failure modes before they happen; the 2019 AIAG-VDA handbook replaced the RPN with action priority
A worked FMEA with its risk map is in the operational excellence library.
See the quality system these tools would serve
Programs, release decisions and design-space controls, each on its own page.