

EUTECNIQ Sciences

See every page on one mapArrow keys move through results · Enter opens · Esc closes

Academy · Course 8 Peer-reviewed data Calculators

pH changes by more than five units along the gut, so where a compound dissolves shapes how much of a dose reaches the blood

An oral dose from stomach to colon: how pH sets solubility and lipophilicity, when the dose itself becomes the limit, and how gut wall, liver and bacteria change what circulates.

Level
Intermediate
Reading time
About 35 minutes
Builds on
Bioavailability by design
Tools
3 calculators, 1 3D viewer, 1 heat map

Related: nine botanical actives on the general solubility equation · bioavailability design

7.5mean pH in the terminal ileum, after a gastric range of 1.0 to 2.5 (66 subjects)
250mL in which ICH M9 asks the highest dose to dissolve, at every pH from 1.2 to 6.8
0.36%absolute oral bioavailability of berberine in rats; the small intestine disposed of about half the dose
59%of 29 vegetarians made equol from soy, against 25% of 12 non-vegetarians
At a glance

Four compounds span the acid–base range, from ferulic acid to berberine, which is charged at every pH

Rotate each compound in 3D; its ionizable groups decide how pH changes its solubilityComputed conformer
Structures: PubChem isomeric SMILES (CIDs 445858, 969516, 638024, 2353), retrieved October 24, 2026. One low-energy gas-phase conformer each, computed with RDKit ETKDGv3 and MMFF94; not a crystal structure. pKa values and sources: section 3 table.
Data table: the four compounds
Compounds shown in the viewer
CompoundPubChem CIDFormulaAcid–base behavior used in this course
Ferulic acid445858C10H10O4Weak acid, pKa 4.58
Curcumin969516C21H20O6Weak acid, pKa 8.38 and 9.88
Piperine638024C17H19NO3No ionizable group (neutral)
Berberine2353C20H18NO4+Quaternary nitrogen: charged at every pH

Drag or use the arrow keys to rotate; the charge sits on berberine's ring nitrogen at every pH.

You will learn

  1. How pH, transit time and fluid volume change from stomach to colon.
  2. How to predict the solubility of acids, bases, ampholytes and permanent ions from pKa.
  3. What log D, the dose number and the ICH M9 solubility test tell you.
  4. Why dissolved compounds can still precipitate, be pumped back or be metabolized.
  5. How gut bacteria and dose size change exposure, with real human data.

Status. EUTECNIQ has no laboratory or data of its own. Results shown are published third-party studies; calculators are educational models.

1 · The gut as a chemical sequence

pH rises from about 1.7 in the fasted stomach to 7.5 in the terminal ileum, then drops again in the caecum

A tablet meets acid for roughly an hour, near-neutral fluid for several hours, then a bacterial ecosystem. Water is scarce and sits in separate pockets.

Four chemical environments, each with its own pH, time and waterPublished data, schematic
Schematic of the gut as four chemical environments: the acidic stomach, the duodenum near pH 6, the jejunum and ileum rising to pH 7.5 where most absorption happens, and the caecum and colon where bacteria act; each with transit time, fluid volume and what happens to an ionizable compoundStomach: pH 1.0–2.5 fastedStomachpH 1.0–2.5 fastedH+​H+​H+​H+​Duodenum: pH about 6DuodenumpH about 6Jejunum and ileum: pH 6.6, rising to 7.5Jejunum and ileumpH 6.6, rising to 7.5Caecum and colon: pH 5.7–6.4, rising to 6.6–7.0Caecum andcolonpH 5.7–6.4, rising to6.6–7.0pylorusileocaecal valveOraldoseFill shows pHacidicnear neutralTime and distance not to scaleWater: half emptied in 13 min. pHcapsule: 1.1 h (median)Start of small-intestinaltransitAbout 3 h for dosage forms; 8 h for a pHcapsule (median)17.5 h for a pH capsule (median)TransitResting water 35 mLBile and pancreatic juiceenterFasted water 43–105 mL, held in separatepocketsFree water about 13 mLFluidWeak bases ionize and dissolve;weak acids stay neutralWeak acids ionize; bile-saltmicelles take up lipophiliccompoundsMain absorbing surface; conjugation in thegut wall; P-gp pumps some compoundsbackBacteria transform what was notabsorbed (urolithins, equol)ChemistrySchematic of the gut as four chemical environments with pH, transit time, fluid volume and chemistry for eachOral dose, top to bottom; not to scaleStomachpH 1.0–2.5 fastedTransitWater: half emptied in 13 min. pH capsule: 1.1 h(median)FluidResting water 35 mLChemistryWeak bases ionize and dissolve; weak acidsstay neutralDuodenumpH about 6TransitStart of small-intestinal transitFluidBile and pancreatic juice enterChemistryWeak acids ionize; bile-salt micelles take uplipophilic compoundsJejunum and ileumpH 6.6, rising to 7.5TransitAbout 3 h for dosage forms; 8 h for a pHcapsule (median)FluidFasted water 43–105 mL, held in separatepocketsChemistryMain absorbing surface; conjugation in the gutwall; P-gp pumps some compounds backCaecum and colonpH 5.7–6.4, rising to 6.6–7.0Transit17.5 h for a pH capsule (median)FluidFree water about 13 mLChemistryBacteria transform what was not absorbed(urolithins, equol)
Not to scale. pH: Evans et al. 1988; Fallingborg 1999. Transit: Mudie et al. 2014 (water); Fallingborg et al. 1989 (pH capsule, medians); Davis et al. 1986 (dosage forms, about 3 h ± 1 h SEM). Water: Mudie et al. 2014 (mean ± SEM 35 ± 7 mL gastric, 43 ± 14 mL small bowel); Schiller et al. 2005 (105 ± 72 mL fasted small intestine, 13 ± 12 mL colon). P-gp: Thiebaut et al. 1987. Gut-wall conjugation: Ireson et al. 2002.
Text version of the gut map

Stomach. pH 1.0–2.5 when fasted. A 240 mL glass of water was half emptied in 13 ± 1 min; a pH capsule stayed 1.1 h (median). Resting water 35 ± 7 mL. Weak bases ionize and dissolve; weak acids stay neutral.

Duodenum. pH about 6; bile and pancreatic juice enter. Weak acids ionize; bile-salt micelles take up lipophilic compounds.

Jejunum and ileum. pH 6.6 rising to 7.5. Small-intestinal transit was about 3 h for dosage forms by scintigraphy and 8 h (median) for a pH capsule. Fasted water 43–105 mL in two MRI studies, held in separate pockets. The main absorbing surface, with conjugating enzymes and P-glycoprotein in the epithelium.

Caecum and colon. pH 5.7–6.4 in the caecum, rising to 6.6–7.0 toward the rectum. Colonic transit of a pH capsule 17.5 h (median); free water about 13 mL. Bacteria transform what was not absorbed.

Measured pH by segment in three human studiesHuman data
Dot plot of measured gastrointestinal pH by segment from three studies: fasted stomach 1.0 to 2.5 and median 1.7, after a meal up to 6.7, duodenum 5.4 to 6.4, proximal small intestine 6.6, terminal ileum 7.3 to 7.5, caecum 5.7 to 6.4, and the distal colon or rectum 6.6 to 7.0ICH M9 solubility range, pH 1.2–6.8012345678pHStomach, fastedrange 1.0–2.5Stomach, fasted: pH 1.7 (Dressman et al. 1990, fasted median)Stomach, after a meal (peak)back to the fasted value within 2 hStomach, after a meal (peak): pH 6.7 (Dressman et al. 1990, fed median)DuodenumDuodenum: pH 6.1 (Dressman et al. 1990, fasted median)Duodenum: pH 5.4 (Dressman et al. 1990, fed median)Duodenum: pH 6.4 (Fallingborg et al. 1989, n = 39)Proximal small intestineProximal small intestine: pH 6.6 (Evans et al. 1988, mean ± SD, n = 66)Terminal ileum (distal small intestine)Terminal ileum (distal small intestine): pH 7.5 (Evans et al. 1988, mean ± SD, n = 66)Terminal ileum (distal small intestine): pH 7.3 (Fallingborg et al. 1989, n = 39)CaecumCaecum: pH 6.4 (Evans et al. 1988, mean ± SD, n = 66)Caecum: pH 5.7 (Fallingborg et al. 1989, n = 39)Left colon (Evans) · rectum (Fallingborg)Left colon (Evans) · rectum (Fallingborg): pH 7.0 (Evans et al. 1988, mean ± SD, n = 66)Left colon (Evans) · rectum (Fallingborg): pH 6.6 (Fallingborg et al. 1989, n = 39)Evans et al. 1988, mean ± SD, n = 66Evans et al. 1988, mean ± SD, n = 66Fallingborg et al. 1989, n = 39Fallingborg et al. 1989, n = 39Dressman et al. 1990, fasted medianDressman et al. 1990, fasted medianDressman et al. 1990, fed medianDressman et al. 1990, fed median
Evans DF et al. Gut. 1988;29:1035–1041 (radiotelemetry capsule, 66 subjects, mean ± SD). Fallingborg J et al. Aliment Pharmacol Ther. 1989;3:605–613 (39 subjects). Dressman JB et al. Pharm Res. 1990;7:756–761 (medians). ICH M9 (2019) range shaded.
Show the data: gastrointestinal pH
SegmentpHStatisticStudy
Stomach, fasted1.0–2.5range, all subjectsEvans et al. 1988
Stomach, fasted1.7medianDressman et al. 1990
Stomach after a meal6.7median peak; back to fasted value in under 2 hDressman et al. 1990
Duodenum, fasted6.1medianDressman et al. 1990
Duodenum, after a meal5.4medianDressman et al. 1990
Duodenum6.4reported valueFallingborg et al. 1989
Proximal small intestine6.6 ± 0.5mean ± SD, first hourEvans et al. 1988
Terminal ileum7.5 ± 0.4mean ± SDEvans et al. 1988
Distal small intestine7.3reported valueFallingborg et al. 1989
Caecum6.4 ± 0.4mean ± SDEvans et al. 1988
Caecum5.7reported valueFallingborg et al. 1989
Left colon, final value7.0 ± 0.7mean ± SDEvans et al. 1988
Rectum6.6reported valueFallingborg et al. 1989
Explanation, details and sources

Food changes the picture. After a meal the stomach briefly reached pH 6.7, while the duodenum fell to 5.4 and stayed below its fasted value for the 4 hours observed (Dressman et al. 1990).

For a product decision. Release site matters. A weak acid released in the stomach meets its lowest solubility first; a weak base meets its highest, then risks precipitating once it empties (section 5). Fasted and fed testing can give different answers for the same capsule.

2 · Charge and solubility

Weak acids dissolve more as pH rises above their pKa, weak bases as it falls below theirs, and permanent ions follow neither rule

Avdeef A. Adv Drug Deliv Rev. 2007;59:568–590; Avdeef A. Absorption and Drug Development, 2nd ed. Wiley; 2012. For an ampholyte, pKa1 < pKa2 are the macroscopic constants on either side of the neutral (or zwitterionic) form.
The same equation gives opposite pH profiles for acids and basesComputed from measured pKa
Two panels computed with the Henderson-Hasselbalch equation: the share of molecules that are un-ionized falls above an acid's pKa and below a base's pKa, and solubility rises tenfold per pH unit beyond the pKa; a permanent cation such as berberine is charged at every pHWeak acid (ferulic acid, pKa 4.58)Weak base (ephedrine, pKa 9.65)Ampholyte (illustrative pKa 3.0 and 8.0)Permanent cation (berberine)Stomach, fastedSmall intestine0%25%50%75%100%0246810pHA · Share of molecules un-ionizedWeak acid (ferulic acid, pKa 4.58)Weak base (ephedrine, pKa 9.65)Ampholyte (illustrative pKa 3.0 and 8.0)Permanent cation: 0% un-ionized at every pHhalf ionized at pH = pKaStomach, fastedSmall intestine1×10×100×1,000×10,000×0246810pHB · Solubility relative to the neutral form, S/S0​ (log)Weak acid (ferulic acid, pKa 4.58)Weak base (ephedrine, pKa 9.65)Ampholyte (illustrative pKa 3.0 and 8.0)beyond the pKa:×10 per pH unit
Henderson–Hasselbalch curves. Ferulic acid pKa 4.58 and ephedrine pKa 9.65 (PubChem, from Serjeant & Dempsey 1979 and Avdeef 2012); the ampholyte pKa values are illustrative. Panel B is truncated at 10,000×; real curves level off at the salt's own solubility.
Ten plant compounds and where they carry a chargePubChem and peer-reviewed values
Skeletal structures of ten plant compounds used on this page, drawn from PubChem SMILES, with their acid-base class, measured pKa and log POOHOHSalicylic acidweak acidpKa 2.98log P 2.26OHOHOHOOHGallic acidweak acidpKa 4.40log P 0.70OOOHOHFerulic acidweak acidpKa 4.58log P 1.51OOHOHOHCaffeic acidweak acidpKa 4.62log P 1.15OOOHOHOHOHOHQuercetinweak acid, several pKapKa 7.03, 9.15log P 2.35 (derived)OOOOHOOHCurcuminweak acid, several pKapKa 8.38, 9.88, 10.51log P 3.2 (predicted)OHNHEphedrineweak basepKa 9.65log P 1.13NNONONCaffeinevery weak base, neutral in the gutpKa 0.7log P −0.07ON+OOOBerberinepermanent cationno ionizable grouplog P −1.5 (salt, apparent)NOOOPiperineneutral in the gutno pKa in gut rangelog P 3.5 (predicted)
Structures drawn with RDKit from PubChem SMILES (CIDs 338, 370, 445858, 689043, 5280343, 969516, 9294, 2519, 2353, 638024). Constants and their sources are in the table under section 3. Ephedrine is shown as chemistry only.
For berberine chloride, buffer and temperature mattered and pH did notMeasured data
Bar chart of berberine chloride solubility measured by Battu and colleagues: 5.27 mM in water and 4.05 mM in pH 7.0 phosphate buffer at 25 degrees C, 8.50 and 9.69 mM at 37 degrees C, and nearly 20-fold lower than pH 7.0 phosphate in hydrochloric acid, phthalate and borate buffers at 25 degrees CWater, 25 °CWater, 25 °C: 5.27 ± 0.29 mM5.27 ± 0.29 mMPhosphate buffer pH 7.0, 25 °CPhosphate buffer pH 7.0, 25 °C: 4.05 ± 0.09 mM4.05 ± 0.09 mMWater, 37 °CWater, 37 °C: 8.5 ± 0.4 mM8.50 ± 0.40 mMPhosphate buffer pH 7.0, 37 °CPhosphate buffer pH 7.0, 37 °C: 9.69 ± 0.37 mM9.69 ± 0.37 mMHCl pH 1.2, phthalate pH 3.0 and 5.0,borate pH 9.0, 25 °CReported as nearly 20-fold lower than in pH 7.0 phosphate buffer“nearly 20-fold lower” than pH 7.0 phosphate, about 0.2 mMSame buffer salt, any pHWhen every buffer wasmade from phosphate salts,pH 2.0 to 9.0, solubility didnot change with pH0246810Solubility of berberine chloride, mM (value ± spread as reported)
Battu SK et al. AAPS PharmSciTech. 2010;11(3):1466–1475 (shake-flask; 1.96 ± 0.11 mg/mL in water at 25 °C; buffers 200 mM). The light bar marks the reported "nearly 20-fold lower" values; individual values are not given in the text.
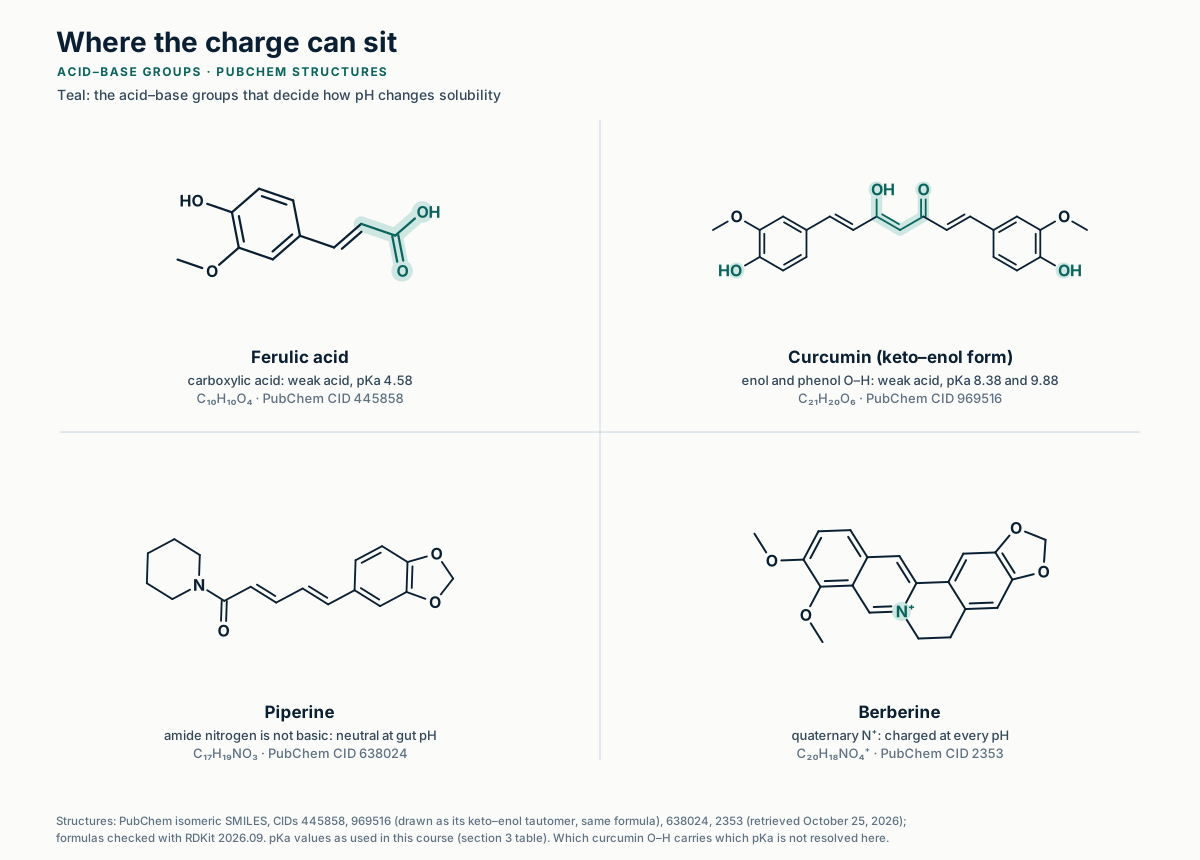
A carboxylic acid, enol and phenol O–H groups, no ionizable group, and a permanent cation: four ways pH can actReference structures
Skeletal formulas of four compounds with their acid–base groups in teal: the carboxylic acid of ferulic acid (pKa 4.58), the enol and phenol O–H groups of curcumin (pKa 8.38 and 9.88), piperine with no ionizable group, and the quaternary ring nitrogen of berberine, which carries a positive charge at every pH.
Structures: PubChem isomeric SMILES, CIDs 445858, 969516, 638024, 2353 (retrieved Oct 25, 2026); RDKit 2026.09 2D depiction; pKa values from this course's section 3 table. Generated illustration, EUTECNIQ. Full-size SVG
Show the data: berberine chloride solubility
Medium25 °C, mM37 °C, mM
Water5.27 ± 0.298.50 ± 0.40
Phosphate buffer pH 7.04.05 ± 0.099.69 ± 0.37
HCl pH 1.2; phthalate pH 3.0 and 5.0; borate pH 9.0"nearly 20-fold lower" than pH 7.0 phosphatenot reported
Phosphate salts at every pH from 2.0 to 9.0pH-independent (data not shown in the paper)not reported

Battu et al. 2010, Results. The paper also reports an experimental log P of −1.5 (shake flask) against computed values of −0.9 to −2.2.

Solubility, fasted stomach (pH 1.7)
Solubility, proximal small intestine (pH 6.6)
Dose number, stomach
Dose number, small intestine
Lowest solubility, pH 1.2–6.8
Volume to dissolve one dose there

Solubility across the gut for the chosen compoundEducational simulation
Solubility and dose number by segment (fasted reference pH)
SegmentpHSolubilityS/S0Dose number
Stomach, fasted1.7
Duodenum6.1
Proximal small intestine6.6
Terminal ileum7.5
Caecum6.4
Reference pH: Dressman et al. 1990 (stomach, duodenum); Evans et al. 1988 (small intestine, ileum, caecum). Dose number with V0 = 250 mL.
Method, assumptions and limits
What it calculates
Total equilibrium solubility at each pH, its gain over the neutral form, the dose number in each segment, and the lowest solubility over pH 1.2–6.8 with the volume needed to dissolve the dose there.
Equations
Acid: S = S0(1 + 10pH−pKa1 + 102pH−pKa1−pKa2), the last term only for two-pKa acids; base: S = S0(1 + 10pKa1−pH); ampholyte: S = S0(1 + 10pKa1−pH + 10pH−pKa2); neutral and permanent ions: S = S0. Then S = min(S, ceiling). Do = dose/(250 mL × S). Volume = dose/Smin.
Variables and units
S0, ceiling and S in µg/mL (sliders are log10); dose in mg (log10 slider); volume in mL.
Assumptions
Equilibrium with one solid form; activity effects, common-ion effects, buffer capacity, bile micelles and temperature ignored. The pH at which the lowest solubility occurs is found exactly: S(pH) is convex, so the minimum sits at pH 1.2, at 6.8 or, for an ampholyte, at the mean of its two pKa values.
Valid range
pKa 0–14. Real profiles often depart from this shape; Bergström and Avdeef (2019) show salts, aggregates and buffer interactions distorting measured curves.
What it does not establish
The solubility of any real ingredient (S0 is your input), dissolution rate, absorption or bioavailability. ICH M9 classification applies to drugs and requires measured data at 37 ± 1 °C.
References
Avdeef 2007 and 2012; Bergström & Avdeef 2019; Amidon et al. 1995; ICH M9 (2019); pKa sources in the section 3 table.
Verification
Unit tests (tests/unit/acsol.test.js) and an independent Python reference (tests/numerics/ref/academy_solubility-and-ph.py) recompute every readout.
Explanation, details and sources

The pKa is the pH at which half the molecules carry a charge. Charged molecules are far more soluble in water than neutral ones, so total solubility S grows tenfold for every pH unit past the pKa.

Henderson–Hasselbalch solubilityAcid: S = S0(1 + 10pH − pKa)
Base: S = S0(1 + 10pKa − pH)
Ampholyte: S = S0(1 + 10pKa1 − pH + 10pH − pKa2)
Where it comes from (weak acid)Ka = [H⁺][A⁻]/[HA]
at saturation [HA] = S0
S = [HA] + [A⁻] = S0(1 + Ka/[H⁺])

Berberine shows the limit of the equation. Its nitrogen is quaternary, so it is charged at every pH; Battu and colleagues found its chloride nearly 20 times less soluble in hydrochloric acid, phthalate and borate buffers than in pH 7.0 phosphate, yet pH-independent when every buffer was made from phosphate salts.

Limits. Measured curves often bend away from the equation through salts, aggregates and buffer interactions. Normalized for pH and temperature, 34 published studies of diclofenac gave its intrinsic solubility with a standard deviation of 0.18 log units, so careful measurements do agree when conditions are stated (Bergström and Avdeef 2019).

Calculator 1 · pH–solubility profile, GI map and dose number

Pick a compound to load its measured pKa values, then set the intrinsic solubility and the dose. Presets fill in pKa only; S0 and dose are your inputs.

3 · Lipophilicity depends on pH

Once a compound is mostly ionized, log D falls by one unit for every pH unit

Distribution coefficient, if only the neutral form partitionslog D = log P − log10(S/S0), the same ionization ratio as in section 2. Acid: log D = log P − log10(1 + 10pH − pKa)
Most phenolic acids switch charge between stomach and intestine; curcumin and piperine do notPubChem and peer-reviewed values
Chart of measured constants for ten plant compounds: pKa values placed on a pH scale from 0 to 14 against the stomach and small-intestine pH ranges, and log P bars that mark measured, derived, predicted and apparent valuesStomach, fastedSmall intestine02468101214−2−101234pKa, on the pH scalelog P (octanol–water)A · Where each compound changes chargeB · Lipophilicity of the neutral formSalicylic acidSalicylic acid: pKa 2.98 (acid)2.98Salicylic acid: log P 2.26 (measured)2.26Gallic acidGallic acid: pKa 4.4 (acid)4.40Gallic acid: log P 0.7 (measured)0.70Ferulic acidFerulic acid: pKa 4.58 (acid)4.58Ferulic acid: log P 1.51 (measured)1.51Caffeic acidCaffeic acid: pKa 4.62 (acid)4.62Caffeic acid: log P 1.15 (measured)1.15QuercetinQuercetin: pKa 7.03 (acid)Quercetin: pKa 9.15 (acid)7.03, 9.15Quercetin: log P 2.35 (derived)2.35CurcuminCurcumin: pKa 8.38 (acid)Curcumin: pKa 9.88 (acid)Curcumin: pKa 10.51 (acid)8.38, 9.88, 10.51Curcumin: log P 3.2 (predicted)3.2EphedrineEphedrine: pKa 9.65 (conjugate acid of the base)9.65Ephedrine: log P 1.13 (measured)1.13CaffeineCaffeine: pKa 0.7 (conjugate acid of the base)0.7Caffeine: log P -0.07 (measured)−0.07Berberinecharged at every pH (quaternary N)Berberine: log P -1.5 (apparent)−1.5Piperineno ionizable group in the gut pH rangePiperine: log P 3.5 (predicted)3.5acid pKa (first; open = further pKa)base pKalog P measuredderived from log D at pH 7.4predicted (XLogP3)apparent, chloride salt
Values and sources in the table below. Quercetin's log P is derived from its log D at pH 7.4 (Rothwell et al. 2005) and pKa (Sauerwald et al. 1998).
Show the data: pKa and log P of the ten compounds
Compound (PubChem CID)TypepKalog PSources and status
Salicylic acid (338)acid2.98 (20 °C)2.26pKa: CRC Handbook via HSDB; log Kow: Hansch et al. 1995 via HSDB. Measured.
Gallic acid (370)acid4.400.70pKa: Patty 1963 via HSDB; log Kow: Hansch et al. 1995. Measured.
Ferulic acid (445858)acid4.581.51pKa: Serjeant & Dempsey 1979 via HSDB; log Kow: Hansch et al. 1995. Measured.
Caffeic acid (689043)acid4.62 (25 °C)1.15pKa: Serjeant & Dempsey 1979 via HSDB; log Kow: Sangster 1993 via HSDB. Measured.
Quercetin (5280343)acid, two pKa7.03; 9.152.35pKa: Sauerwald et al. 1998 (UV-visible, measured). log D7.4 1.82 ± 0.32 measured (Rothwell et al. 2005); log P derived from it.
Curcumin (969516)acid, three pKa8.38; 9.88; 10.513.2pKa: Bernabé-Pineda et al. 2004 (measured). log P: XLogP3, PubChem (predicted).
Ephedrine (9294)base9.65 (25 °C)1.13Both from Avdeef 2012 via HSDB. Measured. Chemistry only.
Caffeine (2519)very weak base0.7 (cation)−0.07pKa: Svorc 2013 via HSDB; log Kow: Hansch et al. 1995. Measured.
Berberine (2353)permanent cationnone−1.5Battu et al. 2010: "permanently charged", shake-flask log P of the chloride (apparent).
Piperine (638024)neutral (amide)none in the gut range3.5log P: XLogP3, PubChem (predicted).

PubChem compound records (Dissociation Constants and LogP sections, accessed October 23, 2026); HSDB entries cite the original sources named.

log D of ten compounds from pH 1 to 8Computed from measured constants
Heat map of log D, the octanol-water distribution coefficient, computed for ten plant compounds at pH 1 to 8 from their pKa and log P: acids lose lipophilicity as pH rises, bases as it falls, and berberine and piperine do not change1234566.577.58Salicylic acidSalicylic acid at pH 1: log D 2.262.3Salicylic acid at pH 2: log D 2.222.2Salicylic acid at pH 3: log D 1.951.9Salicylic acid at pH 4: log D 1.201.2Salicylic acid at pH 5: log D 0.240.2Salicylic acid at pH 6: log D −0.76−0.8Salicylic acid at pH 6.5: log D −1.26−1.3Salicylic acid at pH 7: log D −1.76−1.8Salicylic acid at pH 7.5: log D −2.26−2.3Salicylic acid at pH 8: log D −2.76−2.8Gallic acidGallic acid at pH 1: log D 0.700.7Gallic acid at pH 2: log D 0.700.7Gallic acid at pH 3: log D 0.680.7Gallic acid at pH 4: log D 0.550.6Gallic acid at pH 5: log D 0.000.0Gallic acid at pH 6: log D −0.91−0.9Gallic acid at pH 6.5: log D −1.40−1.4Gallic acid at pH 7: log D −1.90−1.9Gallic acid at pH 7.5: log D −2.40−2.4Gallic acid at pH 8: log D −2.90−2.9Ferulic acidFerulic acid at pH 1: log D 1.511.5Ferulic acid at pH 2: log D 1.511.5Ferulic acid at pH 3: log D 1.501.5Ferulic acid at pH 4: log D 1.411.4Ferulic acid at pH 5: log D 0.951.0Ferulic acid at pH 6: log D 0.070.1Ferulic acid at pH 6.5: log D −0.42−0.4Ferulic acid at pH 7: log D −0.91−0.9Ferulic acid at pH 7.5: log D −1.41−1.4Ferulic acid at pH 8: log D −1.91−1.9Caffeic acidCaffeic acid at pH 1: log D 1.151.1Caffeic acid at pH 2: log D 1.151.1Caffeic acid at pH 3: log D 1.141.1Caffeic acid at pH 4: log D 1.061.1Caffeic acid at pH 5: log D 0.620.6Caffeic acid at pH 6: log D −0.25−0.2Caffeic acid at pH 6.5: log D −0.74−0.7Caffeic acid at pH 7: log D −1.23−1.2Caffeic acid at pH 7.5: log D −1.73−1.7Caffeic acid at pH 8: log D −2.23−2.2Quercetin †Quercetin † at pH 1: log D 2.352.3Quercetin † at pH 2: log D 2.352.3Quercetin † at pH 3: log D 2.352.3Quercetin † at pH 4: log D 2.352.3Quercetin † at pH 5: log D 2.352.3Quercetin † at pH 6: log D 2.312.3Quercetin † at pH 6.5: log D 2.242.2Quercetin † at pH 7: log D 2.062.1Quercetin † at pH 7.5: log D 1.751.7Quercetin † at pH 8: log D 1.311.3Curcumin *Curcumin * at pH 1: log D 3.203.2Curcumin * at pH 2: log D 3.203.2Curcumin * at pH 3: log D 3.203.2Curcumin * at pH 4: log D 3.203.2Curcumin * at pH 5: log D 3.203.2Curcumin * at pH 6: log D 3.203.2Curcumin * at pH 6.5: log D 3.193.2Curcumin * at pH 7: log D 3.183.2Curcumin * at pH 7.5: log D 3.153.1Curcumin * at pH 8: log D 3.053.0EphedrineEphedrine at pH 1: log D ≤ −3≤ −3Ephedrine at pH 2: log D ≤ −3≤ −3Ephedrine at pH 3: log D ≤ −3≤ −3Ephedrine at pH 4: log D ≤ −3≤ −3Ephedrine at pH 5: log D ≤ −3≤ −3Ephedrine at pH 6: log D −2.52−2.5Ephedrine at pH 6.5: log D −2.02−2.0Ephedrine at pH 7: log D −1.52−1.5Ephedrine at pH 7.5: log D −1.02−1.0Ephedrine at pH 8: log D −0.53−0.5CaffeineCaffeine at pH 1: log D −0.25−0.2Caffeine at pH 2: log D −0.09−0.1Caffeine at pH 3: log D −0.07−0.1Caffeine at pH 4: log D −0.07−0.1Caffeine at pH 5: log D −0.07−0.1Caffeine at pH 6: log D −0.07−0.1Caffeine at pH 6.5: log D −0.07−0.1Caffeine at pH 7: log D −0.07−0.1Caffeine at pH 7.5: log D −0.07−0.1Caffeine at pH 8: log D −0.07−0.1Berberine ‡Berberine ‡ at pH 1: log D −1.50−1.5Berberine ‡ at pH 2: log D −1.50−1.5Berberine ‡ at pH 3: log D −1.50−1.5Berberine ‡ at pH 4: log D −1.50−1.5Berberine ‡ at pH 5: log D −1.50−1.5Berberine ‡ at pH 6: log D −1.50−1.5Berberine ‡ at pH 6.5: log D −1.50−1.5Berberine ‡ at pH 7: log D −1.50−1.5Berberine ‡ at pH 7.5: log D −1.50−1.5Berberine ‡ at pH 8: log D −1.50−1.5Piperine *Piperine * at pH 1: log D 3.503.5Piperine * at pH 2: log D 3.503.5Piperine * at pH 3: log D 3.503.5Piperine * at pH 4: log D 3.503.5Piperine * at pH 5: log D 3.503.5Piperine * at pH 6: log D 3.503.5Piperine * at pH 6.5: log D 3.503.5Piperine * at pH 7: log D 3.503.5Piperine * at pH 7.5: log D 3.503.5Piperine * at pH 8: log D 3.503.5Stomach, fastedSmall intestinepHlog D (more lipophilic →)−3.03.5* log P predicted (XLogP3)† log P derived from log D at pH 7.4 and pKa‡ apparent log P of the chloride salt; HH values below −3 shown as ≤ −3
log D = log P − log10(ionization ratio), constants from the table above. Assumes only the neutral species partitions; real log D of strongly ionized compounds levels off higher through ion-pair partitioning, so values below −3 are shown as ≤ −3.
Show the data: computed log D values
CompoundpH 1234566.577.58
Salicylic acid2.32.21.91.20.2−0.8−1.3−1.8−2.3−2.8
Gallic acid0.70.70.70.60.0−0.9−1.4−1.9−2.4−2.9
Ferulic acid1.51.51.51.41.00.1−0.4−0.9−1.4−1.9
Caffeic acid1.11.11.11.10.6−0.2−0.7−1.2−1.7−2.2
Quercetin2.32.32.32.32.32.32.22.11.71.3
Curcumin3.23.23.23.23.23.23.23.23.13.0
Ephedrine≤ −3≤ −3≤ −3≤ −3≤ −3−2.5−2.0−1.5−1.0−0.5
Caffeine−0.2−0.1−0.1−0.1−0.1−0.1−0.1−0.1−0.1−0.1
Berberine−1.5−1.5−1.5−1.5−1.5−1.5−1.5−1.5−1.5−1.5
Piperine3.53.53.53.53.53.53.53.53.53.5

Calculator 2 · log D across the gut

log D at the chosen pH
Share un-ionized at the chosen pH
log D, fasted stomach (pH 1.7)
log D, proximal small intestine (pH 6.6)
Change from stomach to small intestine

log D against pH, with the gut segmentsEducational simulation
log D = log P − log10(ionization ratio), floored at −4. Presets load the constants in the section 3 table.
Method, assumptions and limits
What it calculates
log D and the un-ionized share at any pH, and at the fasted stomach and proximal small-intestine reference pH.
Equations
log D = log P − log10 r(pH), with r the ionization ratio of section 2; un-ionized share = 1/r. For a permanent ion, log D equals the entered value at every pH.
Variables and units
pKa and pH dimensionless; log P and log D are log10 of octanol/water concentration ratios.
Assumptions
Only the neutral species enters octanol; no ion pairs, no self-association; 25 °C constants used at body temperature.
Valid range
Readouts below −4 are floored and flagged, because ion-pair partitioning dominates there.
What it does not establish
Permeability, absorption or bioavailability. Lipophilicity raises membrane passage but also first-pass loss: across 309 drugs, the fractions escaping gut-wall and liver elimination fell as lipophilicity rose (Varma et al. 2010).
References
Scherrer & Howard 1977; Avdeef 2012; Rothwell et al. 2005; Varma et al. 2010; constant sources in the table above.
Verification
Unit tests and the Python reference check log D at the pKa (log P − log 2), at large ionization, and the quercetin back-calculation.
Explanation, details and sources

log P describes how the neutral form splits between octanol and water. log D counts every species in the water, so it changes with pH (Scherrer and Howard 1977). Membranes pass neutral molecules most easily, the idea behind the pH-partition hypothesis (Shore et al. 1957).

A common misreading. Rothwell and colleagues reported quercetin's "log P" as 1.82, but they measured it at pH 7.4, where about 70% of quercetin is ionized. It is a log D. The derived neutral log P is about 0.5 units higher.

4 · When the dose is the problem

If one dose cannot dissolve in 250 mL at every pH from 1.2 to 6.8, solubility can cap absorption

Dose numberDo = M0V0 · Cs, V0 = 250 mL. Do ≤ 1 at the least soluble pH means the dose can dissolve.
BCS classes and the ICH M9 solubility testICH guideline
The Biopharmaceutics Classification System as defined in ICH M9: four classes from high or low solubility and permeability; a drug substance is highly soluble if its highest single dose dissolves in 250 mL or less across pH 1.2 to 6.8 at 37 degrees C, judged at the lowest solubility in that range, and highly permeable if at least 85% is absorbedClass IIIhigh solubility, lowpermeabilityClass Ihigh solubility, highpermeabilityClass IVlow solubility, lowpermeabilityClass IIlow solubility, highpermeabilityLow permeabilityHigh permeability, fa ≥ 85%HighsolubilityLowsolubilityA · The four BCS classesBiowaivers under ICH M9 are possible for Class I and III drugs; the guideline doesnot apply to supplements.B · Solubility is judged at the least favorable pHpH 1.2pH 4.5pH 6.8012345678pHS0​10 S0​100 S0​1,000 S0​Weak acid, pKa 4.58Weak base, illustrative pKa 5.5acid: lowest at pH 1.2base: lowestat pH 6.8Weak acid pKa 4.58 (ferulic acid); weak base pKa 5.5 (illustrative); S0​ =solubility of the neutral form
ICH M9 Biopharmaceutics Classification System-based Biowaivers, adopted November 20, 2019, sections 1 and 2.1–2.2 (buffers at pH 1.2, 4.5 and 6.8; high permeability when absolute bioavailability is ≥ 85%). Amidon GL et al. Pharm Res. 1995;12:413–420. Curves: Henderson–Hasselbalch.
Explanation, details and sources

ICH M9 states: "A drug substance is classified as highly soluble if the highest single therapeutic dose is completely soluble in 250 ml or less of aqueous media over the pH range of 1.2–6.8 at 37±1°C." The lowest solubility in that range decides.

Worked example. Battu and colleagues noted that at about 2.0 mg/mL, a 100 mg dose of berberine chloride needs over 50 mL of water. Its dose number in water is therefore 100 ÷ (250 × 1.96) = 0.20. In the hydrochloric acid buffer, nearly 20 times less soluble, the same arithmetic gives about 4: the dose would no longer dissolve in 250 mL.

M9 lists caffeine among its model drugs of high permeability. It is a drug guideline: no supplement ingredient is classified this way. The maximum absorbable dose calculator adds permeability and transit, and the delivery tool estimates S0 from log P and melting point.

5 · Dissolution and precipitation

Dissolution speed scales with surface area and the solubility gap, so a weak base can dissolve in the stomach and precipitate in the intestine

The film model of dissolution, and supersaturation after gastric emptyingIllustrative model
Left, the Noyes-Whitney picture of a dissolving particle: flux across a diffusion layer of thickness h is driven by the gap between the solubility at the surface and the bulk concentration. Right, an illustrative model of a weak base that dissolves in the stomach and becomes supersaturated in the small intestine: with fast precipitation the concentration collapses to the solubility, while slowed precipitation keeps it high for longerA · Dissolution across a diffusion layersoliddiffusion layerbulk fluidthickness hCs​: solubility at the surfaceC in the bulkfluxdM/dt = (D·A/h)·(Cs​ − C)D diffusion coefficient, A surface area; the rate falls to zero as C reaches Cs​B · A weak base moving from stomach to small intestine (illustrative)025507510012500.511.522.53Time after the dose, hDissolved in the small intestine, µg/mLfast precipitation: 12% absorbed by 3 hprecipitation inhibited: 68% absorbed by 3 hsolubility atpH 6.6:6.3 µg/mLspring: supersaturated, 17× solubilityparachute: 68% absorbed by 3 hcrash: 12% absorbed by 3 h
A: Noyes AA, Whitney WR. J Am Chem Soc. 1897;19:930–934, in the film form reviewed by Dokoumetzidis & Macheras 2006. B, illustrative: weak base pKa 6.0, S0 5 µg/mL, 50 mg dissolved in the stomach; first-order emptying with a 13-min half-time; 250 mL intestinal fluid at pH 6.6; absorption 1 h⁻¹ from solution; precipitation rate kp(C − S) with kp 20 or 0.5 h⁻¹; no redissolution. Terms "spring" and "parachute": Guzmán HR et al. J Pharm Sci. 2007;96:2686–2702.
Explanation, details and sources

Noyes and Whitney (1897) found that a solid dissolves at a rate proportional to how far the solution is from saturation. When a dissolved weak base empties into pH 6.6, the solution can hold more than its new equilibrium solubility for a while, then crystallize.

Precipitation inhibitors in a formulation aim to stretch the parachute (Brouwers et al. 2009). Whether they do so in people is an empirical question for each product.

6 · Absorption, metabolism and the first pass

A dissolved compound must still cross the gut wall and survive the liver, and each step multiplies the loss

From lumen to blood, with two botanical examplesSchematic, not to scale
Schematic of absorption, distribution, metabolism and excretion after an oral dose: dissolved compound crosses the enterocyte, where P-glycoprotein can pump it back and conjugating enzymes can metabolize it; the portal vein carries what survives to the liver, where more is conjugated and some is secreted in bile; the rest reaches the systemic circulation. Oral bioavailability F is the product of the fraction absorbed, the fraction escaping the gut wall and the fraction escaping the liver. Berberine and curcumin show how small F can beGut lumen (small intestine)Fa​: fraction absorbedpassiveentry of theneutral formP-glycoprotein on the apical membraneP-gpeffluxback tothe lumenUGT · SULTconjugates:glucuronides,sulfatesFg​fractionescaping thegut wallLamina propriacapillaries → portal veinportal veinLiverFh​conjugation and oxidation;P-gp on the bile sidesecretes some compoundsinto bilebileSystemic blooddistribution to tissues;excretion in urine and bileF = Fa​ × Fg​ × Fh​Berberine, ratsAbsolute oral F 0.36%; abouthalf of the dose was lost inthe small intestine. P-gpinhibitors raised absorption6-fold in perfused ratintestine.Curcumin, peopleAfter 10 or 12 g, freecurcumin was detected in 1 of12 people; glucuronide andsulfate conjugates in all, at aratio of 1.92 to 1.Colon: the unabsorbed fraction meets bacteria, which transform somecompounds
F = Fa × Fg × Fh: Varma MV et al. J Med Chem. 2010;53:1098–1108. P-gp on jejunal, colonic and biliary surfaces: Thiebaut F et al. PNAS. 1987;84:7735–7738. Berberine: Liu YT et al. Drug Metab Dispos. 2010;38:1779–1784; Pan GY et al. Pharmacol Toxicol. 2002;91:193–197. Curcumin: Vareed SK et al. Cancer Epidemiol Biomarkers Prev. 2008;17:1411–1417; intestinal conjugation in human tissue fractions: Ireson CR et al. 2002.
Text version of the absorption schematic

Dissolved molecules in the small intestine cross enterocytes mainly as the neutral form. P-gp on the apical membrane can pump some back. Enterocytes conjugate some compounds into glucuronides and sulfates (UGT and SULT enzymes), so only a fraction Fg escapes the gut wall. The portal vein carries the rest to the liver, which conjugates and oxidizes more (Fh) and secretes some compounds into bile. What reaches the systemic blood is F = Fa × Fg × Fh of the dose. Unabsorbed material passes to the colon. In rats, berberine's absolute oral bioavailability was 0.36% and about half of the dose was lost in the small intestine; P-gp inhibitors raised its absorption 6-fold in perfused rat intestine. In people given 10 or 12 g of curcumin, free curcumin was detected in 1 of 12 subjects, while glucuronide and sulfate conjugates were found in all, at a ratio of 1.92 to 1.

Explanation, details and sources

Oral bioavailability is the product of three fractions: absorbed, escaping the gut wall and escaping the liver (Varma et al. 2010). P-glycoprotein (P-gp), an efflux pump on the luminal side of intestinal cells, returns some molecules to the gut (Thiebaut et al. 1987).

7 · Blocking the first pass

Piperine raised serum curcumin in an eight-person study, but a 30-person crossover found no gain in total curcuminoids

Exposure with piperine relative to curcumin alone, by study designHuman and animal PK
Dot plot on a log axis of exposure with piperine relative to curcumin alone: Shoba and colleagues reported 154 percent higher bioavailability in rats and 2000 percent in eight people; a 30-person crossover by Fança-Berthon and colleagues found relative bioavailability of 1.1 for total curcuminoids and for curcumin metabolites, not significant0.25×0.5×1×2×5×10×20×40×no changeExposure with piperine ÷ exposure without (log scale)Shoba et al. 1998 · ratscurcumin 2 g/kg ± piperine 20 mg/kg; serum curcuminShoba et al. 1998 · rats: 2.54×+154% as reported (2.54×)Shoba et al. 1998 · humans, n = 82 g curcumin ± 20 mg piperine; serum curcumin to 6 h;curcumin alone mostly undetectableShoba et al. 1998 · humans, n = 8: 21×+2000% as reported (21×)Fança-Berthon et al. 2021 · n = 30, crossoverpiperine product vs a standard extract, 1,425 mgcurcuminoids each; 24 h; 15 analytesFança-Berthon et al. 2021 · n = 30, crossover: 1.1×1.1 ± 0.79 (SD); not significantFança-Berthon et al. 2021 · same study9 curcumin metabolites only (glucuronides, sulfates,reduced forms)Fança-Berthon et al. 2021 · same study: 1.1×1.1 ± 0.81 (SD); not significant
Shoba G et al. Planta Med. 1998;64(4):353–356 (abstract values). Fança-Berthon P et al. J Nutr. 2021;151:1802–1816, Table 7 (relative bioavailability, AUC0–24 h, mean ± SD; four of the nine authors were affiliated with Naturex, which supplied the reference extract and another tested formulation). UK Committee on Toxicity, COT/2024/07, paragraphs 26–30.
Show the data: piperine and curcumin studies
StudyDesignAnalyteResult
Shoba et al. 1998, ratscurcumin 2 g/kg, piperine 20 mg/kgserum curcuminbioavailability +154%; higher concentration for 1–2 h
Shoba et al. 1998, humansn = 8; 2 g curcumin, 20 mg piperine; sampling 6 h (COT 2024)serum curcumin+2000%; curcumin alone "undetectable or very low"
Fança-Berthon et al. 2021n = 30, randomized open-label crossover; piperine product (1,500 mg of a 95% curcuminoid extract plus 15 mg of a 95% piperine extract) vs a standard 95% curcuminoid extract (1,500 mg) from another supplier; 24 h15 curcuminoids and metabolitesAUC0–24 h 4,380 ± 2,330 vs 5,080 ± 2,410 ng·h/mL; relative bioavailability 1.1 ± 0.79; not significant
Same studyas above9 curcumin metabolitesrelative bioavailability 1.1 ± 0.81
Same studyas aboveunconjugated parent curcuminoidsAUC0–24 h 80.3 ± 176 vs 64.4 ± 123 ng·h/mL
Explanation, details and sources

Shoba and colleagues (1998) gave piperine, "a known inhibitor of hepatic and intestinal glucuronidation", with 2 g of curcumin and reported a 2000% increase in bioavailability. The UK Committee on Toxicity notes that curcumin alone was below the detection limit and that it is not clear how those non-detects entered the AUC.

The mechanism carries a second consequence. In vitro, piperine inhibited P-gp transport of digoxin (IC50 15.5 µM) and CYP3A4 (Bhardwaj et al. 2002), so it can raise exposure to drugs as well. Higher exposure is not efficacy. Combination science and Evidence and pharmacokinetics cover interactions and liver-injury reports.

8 · The second metabolism

Gut bacteria finish the chemistry for some compounds, so exposure depends on which microbes a person carries

The compound that reaches the blood may be one the plant never made. Two people taking the same dose can form different metabolites, or none.

Three bacterial transformations of plant compoundsPeer-reviewed
Three transformations by gut bacteria drawn with PubChem structures: ellagic acid, released from ellagitannins, becomes urolithin A; the soy isoflavone daidzein becomes S-equol in some people; berberine is reduced to dihydroberberine, which is absorbed better and oxidized back to berberine in the gut wallOHOHOOOOOHOHEllagic acidOHOOOHUrolithin Agut bacteria, several stepsTrial foods: walnuts and other nuts, berries,pomegranates; three urolithin metabotypesOOOHOHDaidzeinOOHOHS-equolintestinal bacteriaMade by bacteria in some, but not all, adults; onlythe S enantiomer is formedON+OOOBerberineONOOODihydroberberinebacterial nitroreductasesAbsorbed about 5 times faster in animals, thenoxidized back to berberine in intestinal tissue
Structures from PubChem (CIDs 5281855, 5488186, 5281708, 91469, 2353, 10217), drawn with RDKit. Tomás-Barberán FA et al. J Agric Food Chem. 2014;62:6535–6538. Setchell KDR, Clerici C. J Nutr. 2010;140:1355S–1362S. Feng R et al. Sci Rep. 2015;5:12155 (animal data).
How many people make urolithins or equolHuman data
Range chart of how many people carry the gut bacteria for two transformations: urolithin metabotype A in 25 to 80 percent of volunteers across trials, B in 10 to 50 percent and 0 in 5 to 25 percent; equol producers are about 25 to 30 percent of Western adults and 50 to 60 percent of adults in Japan, Korea or China and of Western vegetariansUrolithin metabotypes, intervention trialsEquol producers0%20%40%60%80%100%Metabotype A (urolithin A only)Metabotype A (urolithin A only): 25–80%25–80%Metabotype B (also isourolithin A or urolithin B)Metabotype B (also isourolithin A or urolithin B): 10–50%10–50%Metabotype 0 (no urolithins detected)Metabotype 0 (no urolithins detected): 5–25%5–25%Adults in Western countries (consensus of larger studies)Adults in Western countries (consensus of larger studies): 25–30%25–30%Adults in Japan, Korea or China, and Western vegetariansAdults in Japan, Korea or China, and Western vegetarians: 50–60%50–60%Vegetarians in one study (n = 29)Vegetarians in one study (n = 29): 59%59%Non-vegetarians in the same study (n = 12)Non-vegetarians in the same study (n = 12): 25%25%Share of people
Urolithin metabotypes across intervention trials: Tomás-Barberán et al. 2014. Equol producers: Setchell & Clerici 2010 (consensus ranges); Setchell KDR, Cole SJ. J Nutr. 2006;136:2188–2193 (41 adults, urinary S-equol:daidzein threshold).
Show the data: producer prevalence
GroupShareSource
Urolithin metabotype A (urolithin A conjugates only)25–80% of volunteersTomás-Barberán et al. 2014
Metabotype B (isourolithin A and/or urolithin B as well)10–50%Tomás-Barberán et al. 2014
Metabotype 0 (none detected)5–25%Tomás-Barberán et al. 2014
Equol producers, Western adults25–30%Setchell & Clerici 2010
Equol producers, adults in Japan, Korea or China, and Western vegetarians50–60%Setchell & Clerici 2010
Vegetarians (n = 29) vs non-vegetarians (n = 12)59% vs 25%Setchell & Cole 2006
9 · Dose dependency

Exposure can rise faster or slower than the dose, and the direction points to the step that saturates

Human dose data for EGCG and curcuminHuman PK
Three panels of human dose data: EGCG exposure rose about 7.4-fold when the dose rose 4-fold from 200 to 800 mg; peak serum curcumin was 0.51, 0.63 and 1.77 micromolar after 4, 6 and 8 g; and curcumin conjugate exposure was lower after 12 g than after 10 g in two groups of six people045901351800200400600800Single dose of EGCG, mgA · EGCG, Chow et al. 2001AUC of EGCG, min·µg/mL, n = 5 per doseproportionalto doseEGCG 200 mg: AUC 22.5 min·µg/mLEGCG 400 mg: AUC 35.4 min·µg/mLEGCG 600 mg: AUC 101.9 min·µg/mLEGCG 800 mg: AUC 167.1 min·µg/mLPolyphenon E, 200 mg EGCG: AUC 21.9 min·µg/mLPolyphenon E, 400 mg EGCG: AUC 52.2 min·µg/mLPolyphenon E, 600 mg EGCG: AUC 79.7 min·µg/mLPolyphenon E, 800 mg EGCG: AUC 161.4 min·µg/mLEGCGPolyphenon E01234468Daily dose of curcumin, gB · Curcumin, Cheng et al. 2001Peak serum curcumin, µM, mean ± reported spread4 g: 0.51 ± 0.11 µM0.516 g: 0.63 ± 0.06 µM0.638 g: 1.77 ± 1.87 µM1.77± 1.87proportional to dose0153045C · Curcumin, Vareed et al. 2008AUC of conjugates, µg·h/mL, mean ± SE, n = 610 g: 35.33 ± 3.7835.3310 g12 g: 26.57 ± 2.9726.5712 gSingle dose (free curcumin detected in 1 of 12)
Chow HH et al. Cancer Epidemiol Biomarkers Prev. 2001;10:53–58 (single doses in 20 healthy adults; authors suggest "saturable presystemic elimination"). Cheng AL et al. Anticancer Res. 2001;21:2895–2900 (patients, 3 months of daily dosing). Vareed SK et al. 2008 (single doses; model-estimated AUC).
Show the data: dose and exposure
StudyDoseExposure
Chow et al. 2001, EGCG200 / 400 / 600 / 800 mgAUC 22.5 / 35.4 / 101.9 / 167.1 min·µg/mL
Chow et al. 2001, Polyphenon E200 / 400 / 600 / 800 mg EGCGAUC 21.9 / 52.2 / 79.7 / 161.4 min·µg/mL
Cheng et al. 2001, curcumin4 / 6 / 8 g per daypeak serum 0.51 ± 0.11 / 0.63 ± 0.06 / 1.77 ± 1.87 µM
Vareed et al. 2008, curcumin conjugates10 / 12 g, n = 6 eachAUC 35.33 ± 3.78 / 26.57 ± 2.97 µg·h/mL (mean ± SE); Cmax 2.30 / 1.73 µg/mL

From 200 to 800 mg, EGCG AUC rose 7.4-fold for a 4-fold dose (our arithmetic from the published means).

Peak concentration Cmax
Time of peak Tmax
AUC0–∞
Fraction of dose absorbed
AUC ÷ AUC if linear
AUC change when the dose doubles

Concentration over time and AUC across dosesEducational simulation
Illustrative parameters, not any compound's. Dashed: linear model with the same low-dose constants.
Method, assumptions and limits
What it calculates
Plasma concentration after one oral dose, Cmax, Tmax, AUC0–∞, the fraction absorbed, AUC relative to the linear model, and the AUC ratio for a doubled dose.
Equations
dA/dt = −ra − ktA; V·dC/dt = ra − re. Linear: ra = kaA, re = CL·C. Saturable elimination: re = CL·C/(1 + C/Km), i.e. Vmax = CL·Km. Saturable absorption: ra = kaA/(1 + A/Km).
Variables and units
Dose and A in mg; C in mg/L; ka, kt in h⁻¹; V in L; CL in L/h; Km in mg/L for elimination and mg (amount in the gut) for absorption. Dose, ka, V, CL and Km sliders are log10.
Assumptions
One well-mixed compartment; one saturable step at a time; unabsorbed drug lost first-order; no metabolites, protein binding or enterohepatic recycling. Integrated by fourth-order Runge–Kutta; after the gut is empty the remaining AUC is added analytically.
Valid range
Within the slider limits. Default kt 0.3 h⁻¹ corresponds to a 3.3 h small-intestinal transit.
What it does not establish
The kinetics of any compound, a safe or effective dose, or the exposure from any product. Real nonlinearity must be shown with dose-ranging data like the studies above.
References
Ludden 1991 (sources of nonlinearity); Chow et al. 2001; Davis et al. 1986 (transit).
Verification
Unit tests compare the linear mode with the analytic Bateman solution and the fast-absorption limit with the Michaelis–Menten bolus result AUC = (C0/Vm)(Km + C0/2). The Python reference integrates the same equations with SciPy's LSODA solver.
Explanation, details and sources

When an enzyme or transporter saturates, pharmacokinetics become nonlinear: concentrations rise disproportionately high or low relative to the dose (Ludden 1991). Saturated first-pass metabolism or elimination bends exposure upward; saturated uptake or dissolution bends it downward.

Worked example. Divide each EGCG AUC by its dose: 0.11 min·µg/mL per mg at 200 mg and 0.21 at 800 mg. Exposure per milligram nearly doubled. A safety margin set from a low-dose study would therefore overstate the margin at a high dose; Course 9 builds on this.

Calculator 3 · One-compartment oral model with a saturable step

All three modes match at low dose. Switch the mode and raise the dose to see which way AUC bends.

10 · Words that get confused

Five distinctions keep a solubility or bioavailability claim honest

  • Dispersibility, droplets or particles suspended≠Solubility, molecules dissolved
  • Bioaccessibility, released in the gut≠Systemic bioavailability, reaching the blood
  • Higher exposure≠Efficacy, or a wider safety margin
  • "log P" measured at pH 7.4≠log P of the neutral form
  • Low exposure≠Poor solubility alone: curcumin about 90% decomposed within 30 min in pH 7.2 buffer at 37 °C (Wang et al. 1997)
Key terms

Ten terms used in this course

Show the 10 key terms
pKa
The pH at which half the molecules of a group are ionized.
Intrinsic solubility, S0
Solubility of the neutral form alone.
Ampholyte
A molecule with both an acidic and a basic group.
log P
Octanol–water partition of the neutral form, as log10.
log D
The same ratio counting every species, at a stated pH.
Dose number
Dose divided by what 250 mL can dissolve.
Supersaturation
Dissolved concentration above equilibrium solubility; it tends to precipitate.
First-pass metabolism
Loss in the gut wall and liver before systemic circulation.
P-glycoprotein
An efflux pump that returns some molecules to the gut lumen.
Nonlinear pharmacokinetics
Exposure that does not scale in proportion to dose.
Check your understanding

Five questions on pH, dose and exposure

Ferulic acid has a pKa of 4.58. Is it more soluble in the fasted stomach or the small intestine?

The small intestine. At pH 6.6 it sits two pH units above its pKa, so its total solubility is about 100 times that of the neutral form; at pH 1.7 it is almost entirely neutral.

Why does berberine's solubility not follow the Henderson–Hasselbalch curve?

Its nitrogen is quaternary, so it is charged at every pH. Its solubility changed with the buffer ions and temperature, and was pH-independent when every buffer used phosphate salts (Battu et al. 2010).

A dose has a dose number of 0.2 at pH 6.8 and 40 at pH 1.2. Is it highly soluble under ICH M9?

No. M9 classifies on the lowest solubility over pH 1.2–6.8, and at pH 1.2 the dose would need 40 × 250 mL to dissolve.

EGCG exposure rose 7.4-fold when the dose rose 4-fold. What does that suggest?

A saturable loss: a process that removes a smaller share at higher doses. Chow and colleagues suggested saturable presystemic elimination. It also means exposure from a high dose cannot be extrapolated linearly from a low one.

Two people take the same soy isoflavone dose; only one forms equol. Why?

Equol is made by gut bacteria that only some adults carry: about 25–30% of Western adults and 50–60% of adults in Japan, Korea or China (Setchell and Clerici 2010).

Continue with toxicology and dose

Course 9 turns exposure into safety margins.