A proposed research program of six model families: four proposed learned models (M1–M4) and two that stay mechanistic until data justify learning. The learned models would draw on authenticated botanical lots and EUTECNIQ’s own measurements, and all six would pass their outputs to one another and serve decisions in the Ingredient Engine. Each model would be funded only after the one before it passes a gate on measured data.
Proposed capabilityEUTECNIQ has no trained machine-learning model, no proprietary dataset and no benchmark of a learned model. Physics-based models have been benchmarked against published measurements, for example COSMO-SAC solubility against 396 measured mixture solubilities on the workstation. Figures on this page are either published data analyzed here or synthetic examples, and each is labeled.
The program at a glance
6
model families, each keeping its own physics and its own test
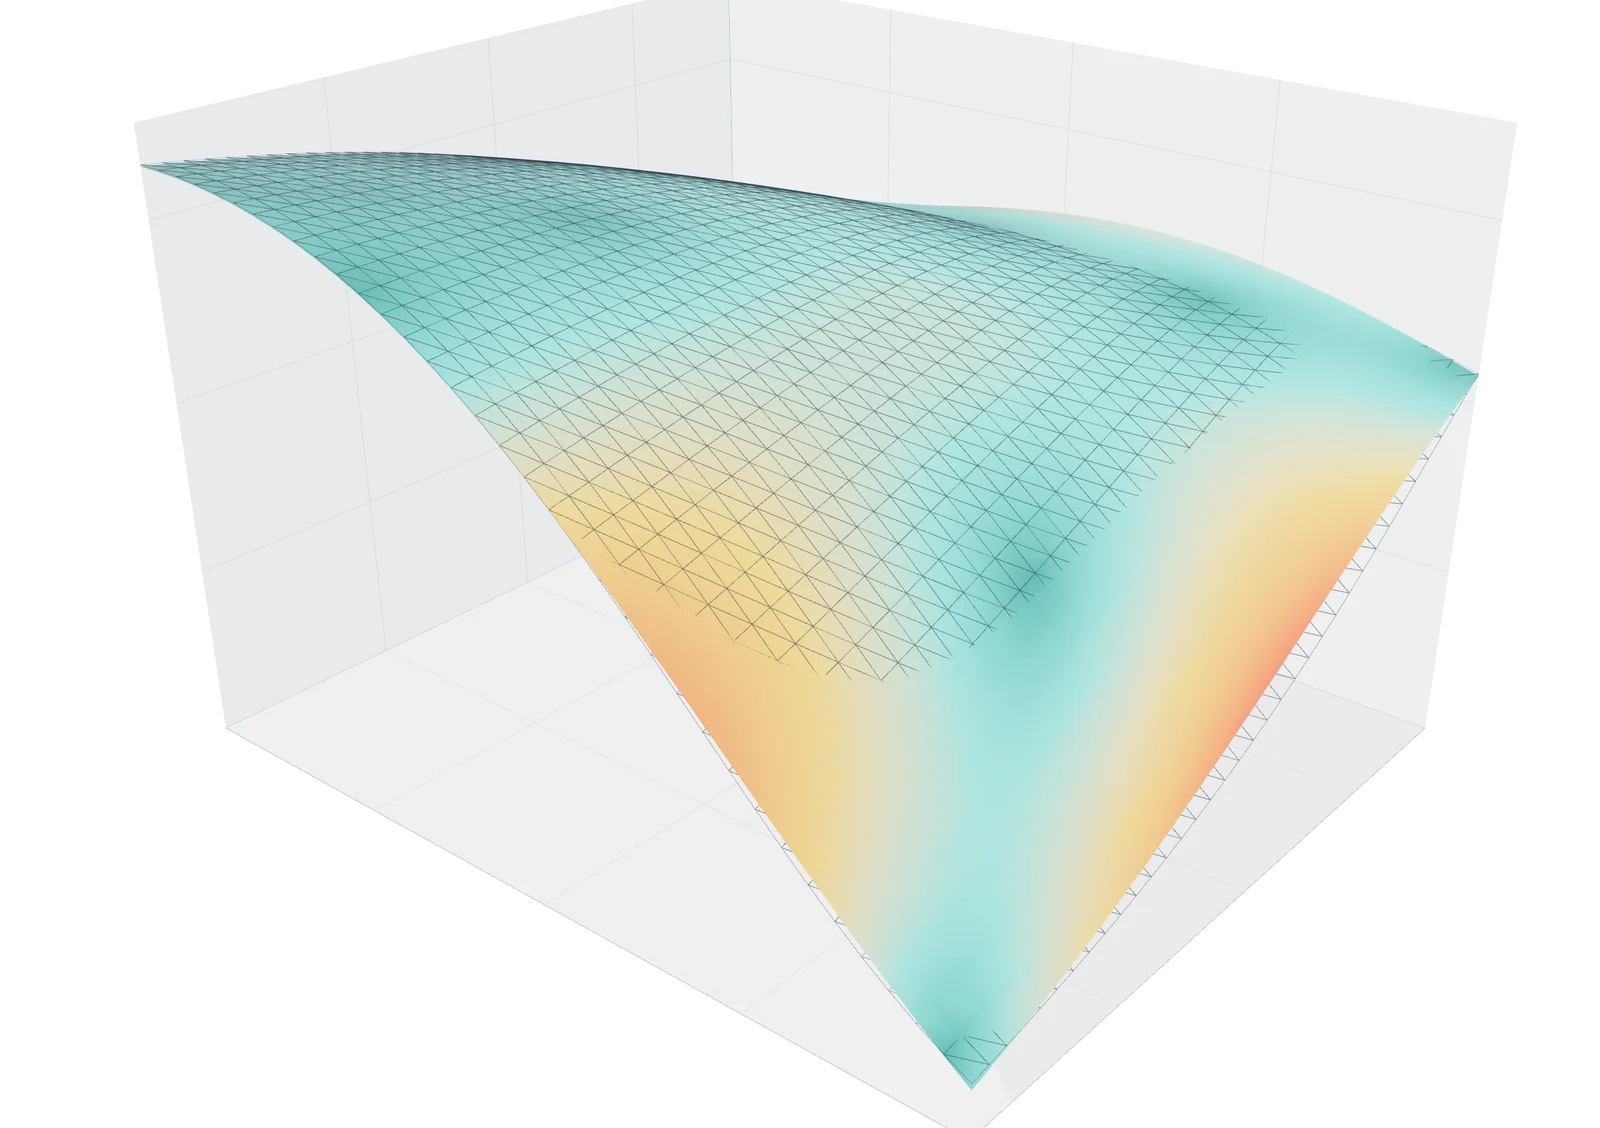
2 Wireframe: the full simulator, 1,296 grid points
3 Color: model uncertainty, low (teal) to high (red)
Data: FIG 047. Gaussian-process surrogate fitted to 15 runs (5 random, 10 chosen by expected improvement) against the 1,296-point simulator grid. Illustrative simulator; all material parameters assumed.
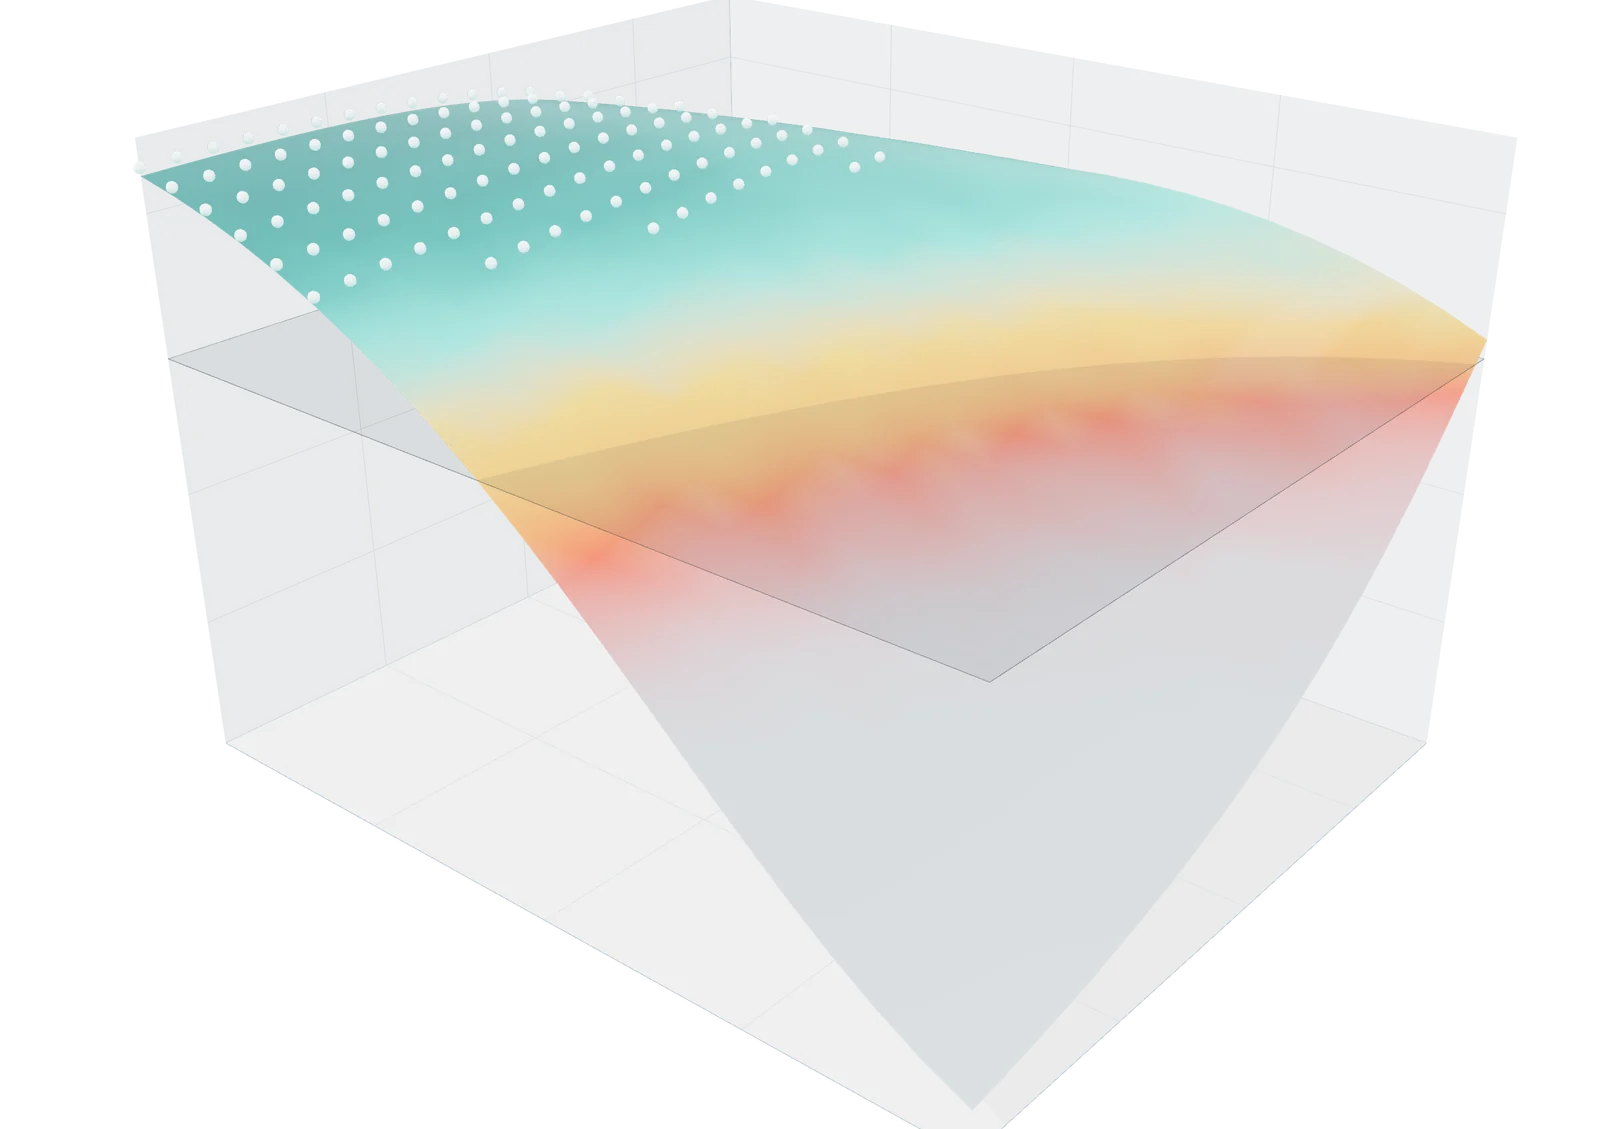
1 Studs: settings that meet the target with at least 90% probability
2 Color: probability of meeting 60%, from gray (0) through red to teal (1)
Data: FIG 052. Monte Carlo, 80 draws of the uncertain material parameters at each of 441 settings. The 60% target is an arbitrary illustration; illustrative simulator.
12345
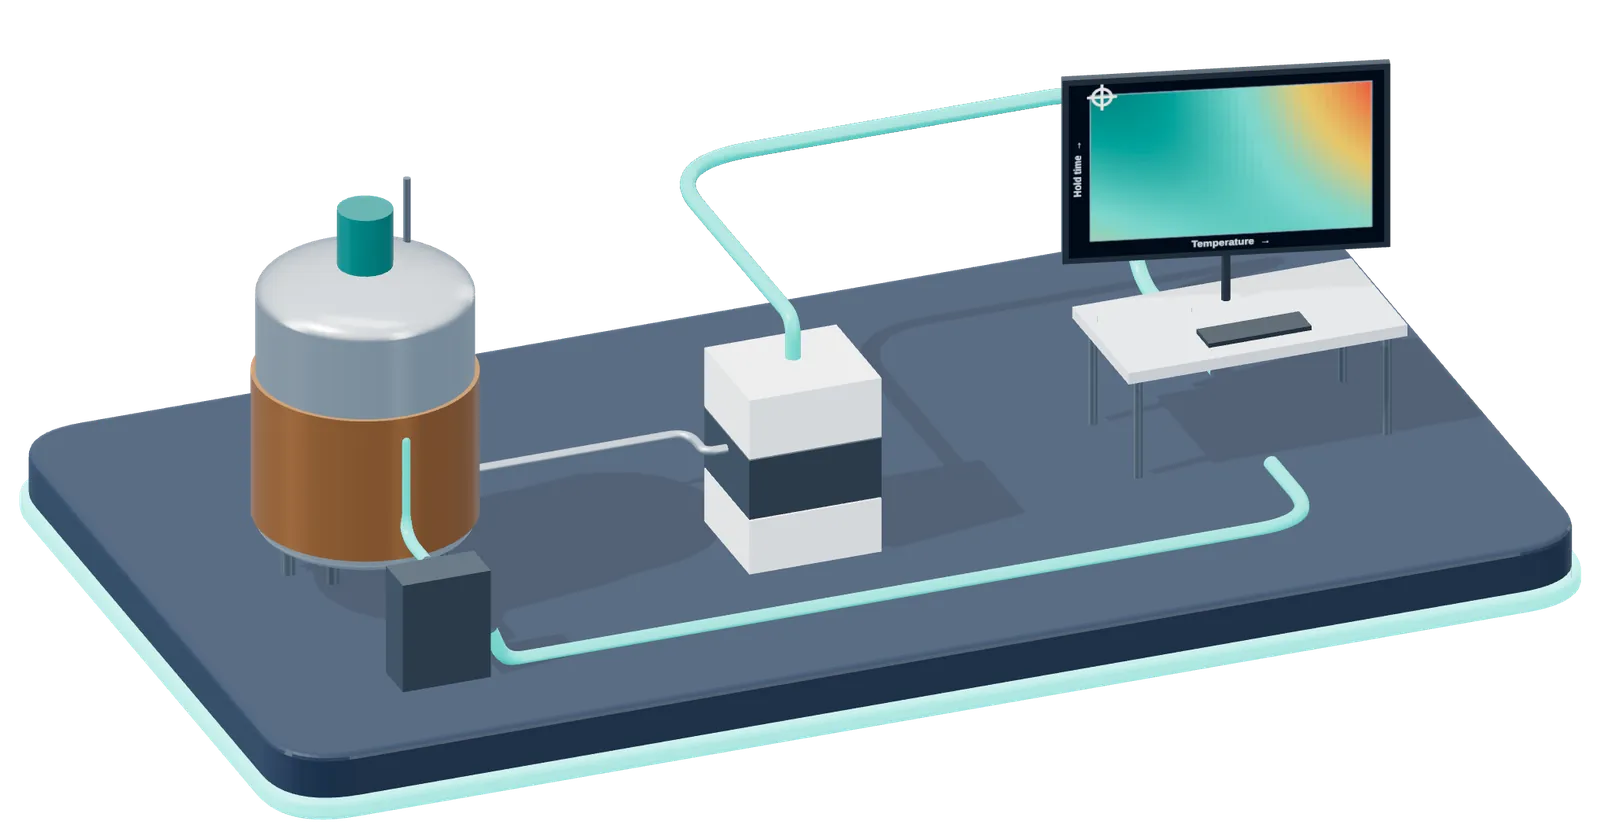
1 Extraction vessel runs one experiment
2 Online analysis measures intact recovery
3 Bayesian optimizer updates its surrogate model and picks the next run (screen: FIG 047)
4 Controller sets the next temperature and hold time
5 Data loop: each run improves the next choice
Closed-loop experimentation (Bayesian optimization), rendered by EUTECNIQ. The screen is FIG 047: the Gaussian-process mean after 15 runs of the illustrative simulator, with its predicted best setting marked. Proposed for the laboratory; no such loop runs yet.
A system that would learn from measured botanical data and keep its physics
The aim is a set of scientific models that learn representations of molecules, plant material, processes, formulations, analytical signals and exposure, and that predict the next development decision with a stated uncertainty. A conversational interface, if built, would only sit in front of them.
What it would do
Rank solvents, process conditions and carriers before laboratory time is spent, with an interval on every prediction.
Propose the next experiment where it would teach the most, and stop when a gain is not shown on held-out material.
Carry one candidate’s data from molecule to process, so that a change at one stage shows its effect on the next.
Why it could be hard to copy
Public collections are open to everyone: COCONUT 2.0 holds 695,133 natural-product structures under CC BY 4.0, and THEOBROMA aggregates 1,132,805 entries from 29 open sources, 896,242 of them (79.12%) under open-use licenses. A model built only on them can be rebuilt by anyone.
What would be hard to rebuild is authenticated lots paired with measured extraction, formulation, stability and process data, and the physics that connects them, owned by EUTECNIQ where contracts allow.
What it could create
Better-founded development decisions, and fewer screening experiments if the gain is measured; none is claimed yet.
Verified process and formulation knowledge, and inventions that may be protectable.
Reusable models and datasets with clear ownership, supporting licensing, manufacturing and supply partnerships.
Six model families, one data infrastructure, each with its own physics and its own test
Choose a family to see what it would learn from, the physics it keeps, what it would predict, what it must show before anyone uses it, what it cannot claim, and which families and Engine stages receive its output. The families are linked: lot composition feeds extraction, extraction feeds delivery, delivery feeds exposure, and the process feeds back into quality.
Educational schematicProposed capability M1 to M4 are the four learned models of the Botanical Intelligence roadmap, which also lists M5 (evidence retrieval for dossiers) and M6 (licensed modules on customer data); the Molecular and Exposure families stay mechanistic until measured data justify a learned layer.
Molecular Physics layer; no learned model proposed yet
Learns from
Structures from open collections (Tier A); density-functional and COSMO-SAC/RS calculations (Tier B); measured solubility and partition for calibration (Tier C). Tier A, Tier B, Tier C
Physics it keeps
Quantum-chemical surface charge profiles and activity coefficients; the general solubility equation as the screening baseline.
Would predict
Solubility, partition and solvent compatibility, each with an interval and a flag when a molecule lies outside the calibrated domain.
Must show before use
Error against measured solubility on compounds and scaffolds held out of calibration; it must beat COSMO-SAC and the general solubility equation alone.
Designed extraction experiments on authenticated lots (Tier C); mass-transfer simulations (Tier B); lot composition and solvent properties from the families above. Tier B, Tier C
Physics it keeps
Mass balance and diffusion out of plant particles; machine learning learns only the residual the physics misses, with the yield bounded between zero and the extractable content.
Would predict
Marker yield, selectivity and recovery, with calibrated intervals, and the next experiment to run (expected improvement).
Must show before use
Gate G1: a gain over physics alone and over a classical designed experiment on an unseen botanical; stated 80% intervals cover about 80%; stops at month 24 without both gains.
Cannot claim
Performance on a botanical outside its training domain.
Millions of calculations are not millions of observations
A physics campaign can generate millions of records quickly. They come from one model and its assumptions, so they are correlated with each other and cannot validate the model that produced them. The ledger keeps every kind of record in its own column.
An illustrative screening campaign
Physics-generated records (Tier B)
2,000,000
Calculated state points: molecules × solvent systems × temperatures × compositions
Independent experimental observations (Tier C)
0
Each future observation needs an authenticated lot and a validated method.
The two columns are never added. The calculated records would train and screen; only the observations, held out by molecule and by botanical, could test the model.
Hypothetical example Campaign sizes are illustrations, not a completed simulation. The arithmetic assumes every molecule has the inputs the method needs, which is not true for many natural products.
Five kinds of record, what each must carry and what it may be used for
Record
Must carry
May train a model
May test a model
Independent experimental observation
Lot, sample, method and its validation status, instrument, unit, measurement uncertainty, analyst and date
Yes
Yes, if held out by botanical and lot before training
Literature measurement
Source, table or figure, method as reported, units converted with the factor recorded, license
Yes, flagged by source
Only as an external set, never mixed into training
Physics-generated record
Model and version, parameters, boundary conditions, numerical tolerance
Yes, as a lower-fidelity level
No
Surrogate-model prediction
The model, its training set and date, and the interval
No
No
Predicted or inferred annotation
The rule or model that assigned it and its confidence
Only where marked and reviewed
No
Published data, analyzed here
The baseline a fingerprint model must beat: 51 ginkgo batches in two principal components
Before any learned model, classical chemometrics already separates unusual batches. On nine constituents measured in 51 market batches, two principal components carry 60.3% of the variance, and three batches fall outside the 95% Hotelling T² limit. A learned fingerprint model (M3) would have to do better than this on blinded lots before it was used.
Similarity ≥ 0.85Similarity < 0.8595% T² limit
With JavaScript on, choosing a batch here or on the plot shows its scores, its distance from the center and its nine measured constituents.
Measured data Liu et al., Chin Med 2022;17:72, Table 2, as used in Demonstration 3. Computed here: PCA of autoscaled concentrations of nine constituents (gallic acid, with 25 missing values, and 6-hydroxykynurenic acid, with 1, are left out). PC1 35.7%, PC2 24.6% of variance; 95% limit T² = 6.63 for two components (F-based limit, used here as an approximation for in-sample batches). Open circles: the 19 batches with published fingerprint similarity below 0.85. Batches V2, X5 and X6 are unusual in composition. That alone is not evidence of adulteration or of any safety problem.
What each component is made of: loadings of the nine constituents
Measured data, computed here A loading is the weight of a constituent in a component. PC1 has positive loadings for eight of the nine constituents (all but quercetin), so batches far to the right are richer in most of them. PC2 is positive for KRCG, QDG, QCG and quercetin and negative for the other five.The nine constituents
pHA p-hydroxybenzoic acid
PA protocatechuic acid
KR kaempferol 3-O-rutinoside
KRCG kaempferol coumaroyl glycoside
QDG quercetin 3-O-(2″,6″-dirhamnosyl)glucoside
QCG quercetin coumaroyl glycoside
Rutin
IR isorhamnetin 3-O-rutinoside
Quercetin free aglycone
Two lessons, shown on synthetic data
Latent-space search needs a validity boundary, and testing needs grouped holdout
Generative design needs a validity boundary
Synthetic example A variational autoencoder maps discrete candidates into a continuous space where search is possible. The highest predicted value here decodes to an invalid structure; the usable answer is the best candidate inside the boundary, and it still has to pass chemical, regulatory and manufacturing checks and a measurement.
Lots of one botanical are near-duplicates
Synthetic example, computed 12 synthetic botanicals × 10 lots; a 3-nearest-neighbor regression. Holding out a random quarter of lots gives RMSE 0.63; holding out whole botanicals gives 1.33 on the same data. Only the second estimates performance on a new botanical. The numbers describe only this synthetic set.
The figure atlas
Fourteen kinds of research figure, where each already stands on the site, and on what data
Each figure has to show a scientific relationship. Where published data exist they are used; where the program has no data yet, the figure says it is synthetic.
Figure types of the research program, where each appears and its data status
In the additive form the learned term g corrects what the physics misses, but nothing in that form keeps the sum physical: outside the data g can push a prediction below zero, above the extractable content or out of a mass balance. A physics baseline alone does not enforce conservation. In the serial form the learned term h estimates a parameter inside the balance equations, so the balance holds by construction, yet h must still be kept to physical values (a diffusivity must stay positive). Conservation and bounds are therefore enforced explicitly: balances as equality constraints and bounds as inequality constraints during fitting, positive or bounded output transforms, or projection of each prediction onto the feasible states, and then checked by counting violations on held-out data. Serial form: Psichogios and Ungar, AIChE J 1992;38:1499–1511; balances as equality constraints, inequality constraints in fitting: Thompson and Kramer, AIChE J 1994;40:1328–1340.
Proposed capability For the extraction model M1, the corrected yield would be bounded between zero and the extractable content, and the share of held-out predictions that break a bound or a balance would be reported with gate G1.
Multi-fidelity learning
fhigh(x) = ρ · flow(x) + δ(x)
Cheap physics records (low fidelity) and scarce measurements (high fidelity) are combined by a scale factor ρ and a discrepancy δ, each a Gaussian process; the autoregressive model of Kennedy and O’Hagan 2000. The measurements decide δ, so they are never outvoted by the volume of calculations.
The posterior mean μ and standard deviation σ at a candidate x weigh a high prediction against high uncertainty to choose the next experiment (Jones et al. 1998; Rasmussen and Williams 2006). Run it.
Scores t on the first a components, scaled by their variances λ; with n = 51 batches and a = 2 the F-based limit is 6.63. A batch beyond it is unusual against the reference set, a question for a confirmatory method (MacGregor and Kourti 1995).
Evaluation protocol
Every model is judged on material it never saw, against the simplest method that could do the job
Evaluation rules that apply to every model family
Rule
What it requires
Why
Grouped holdout
Test sets hold out whole botanicals, lots, suppliers or molecular scaffolds, fixed before training
Random splits leak near-duplicates and overstate accuracy (see the synthetic example above)
Baseline to beat
Physics alone, a classical designed experiment, or a chemometric model, named in advance
A learned model earns its cost only by beating them
Calibration
Stated 80% and 95% intervals cover about 80% and 95% of held-out measurements, inside a preset band
A decision needs an honest error bar
Applicability domain
Inputs outside the training range are flagged and the model abstains
Extrapolation is where confident errors happen
Prospective test
Predictions are recorded before the experiment is run, then compared
The only test free of hindsight
Model card
Intended use, data, metrics, limits and the decisions it must never make, written before training
Four phases, each released only by a measured result
Phase 1
Foundations
Data schema and license audit, the knowledge graph, physics workflows for solubility and mass transfer, and narrow baselines.
Advance if the data are traceable, licensed for the use and informative enough to test a model.
Phase 2 · Gate G1
Hybrid extraction model (M1)
Designed experiments on authenticated lots; the physics core with a learned residual and the next-experiment choice.
Advance if it beats physics alone and a classical design on an unseen botanical, with calibrated intervals. No gain by month 24 stops AI spending; the data are kept.
Phase 3 · Gates G2 to G4
Narrow models, then a shared representation
Formulation (M2), fingerprint (M3) and process (M4) models, each against its own baseline; then a pilot of shared molecular and spectral representations.
Advance if the shared representation improves data efficiency or accuracy over the narrow models on held-out material.
Phase 4 · Gate G5
A larger multimodal model
Only if the pilot gain holds as data grow, with a credibility plan for one defined context of use and quality-assurance approval.
Advance if the benefit justifies the added compute, laboratory and staff cost.
Management proposal Gate thresholds go to the board before each phase; no size, cost or date is claimed beyond the month-24 stop rule. Gate definitions: Computational science and AI.
Data governance
One knowledge graph links every record to its lot, its method and its source
Typed identifiers let a measurement be traced to the plant, the lot, the method and the license it came with. A license is resolved per record, and the most restrictive source governs, the rule THEOBROMA applies across its sources.
Species supplies Raw-material lot
Raw-material lot sampled as Sample
Sample measured in Measurement
Measurement by Method
Molecule occurs in Species
Raw-material lot processed in Process run
Process run produces Extract lot
Extract lot used in Formulation
Formulation tested for Exposure record
Extract lot measured in Measurement
Measurement cited from Source
Educational schematicProposed capability Entity types and relations of the proposed graph. The record fields are set out on one record per lot.
Qualified people make every quality and safety decision, using validated methods; a model only ranks and flags.
Electronic records fall under Part 11 when Part 111 requires the record and it is kept electronically (21 CFR 111.605(c)).
Client data are used only under contract terms.
Every literature answer cites its source, and a scientist checks it before use.
Public resources to evaluate
Open collections and published methods the program would start from
Public resources, their size and how they would be used
Resource
What it holds
How it would be used, and its limit
COCONUT 2.0
695,133 natural-product structures with organisms and references; CC BY 4.0
Structures for Tier A and the Molecular family; it records occurrence, not concentration in a lot
THEOBROMA
1,132,805 natural products from 29 open sources, with a per-compound license tier; 896,242 (79.12%) under open-use licenses
A license-audited structure set; its count overlaps COCONUT’s and must not be added to it
DreaMS and GeMS
A transformer pretrained without labels on millions of tandem mass spectra mined from MassIVE GNPS; the DreaMS Atlas spans 201 million spectra
A candidate spectral encoder for the Quality family, adapted where its license allows; it does not identify a botanical by itself
Open Catalyst 2020 (OC20)
1,281,040 density-functional relaxations, about 265 million single-point evaluations, for catalyst surfaces
Evidence that physics simulation and machine learning can be scaled together; not training data for botanical work
FDA PBPK guidance
The format and content FDA expects in a physiologically based pharmacokinetic report
The reporting structure for the Exposure family; a predicted curve does not establish efficacy
Sources
References cited on this page
Chandrasekhar V, Rajan K, Kanakam SRS, et al. COCONUT 2.0: a comprehensive overhaul and curation of the collection of open natural products database. Nucleic Acids Res. 2025;53(D1):D634–D643. Database counts and license: zenodo.org/records/13897048.
Klamt T, Jaczkowski A, Franke J, Nejdl W. THEOBROMA: an aggregated open database of 1.13 million natural products with per-compound license auditing, three-tier classification, and stereochemistry-aware deduplication. Nucleic Acids Res. Advance article, November 2, 2026. doi.org/10.1093/nar/gkag1083.
Bushuiev R, Bushuiev A, Samusevich R, Brungs C, Sivic J, Pluskal T. Self-supervised learning of molecular representations from millions of tandem mass spectra using DreaMS. Nat Biotechnol. 2026;44:630–640 (published online May 23, 2025). doi.org/10.1038/s41587-025-02663-3.
Chanussot L, Das A, Goyal S, et al. The Open Catalyst 2020 (OC20) dataset and community challenges. ACS Catal. 2021;11:6059–6072. arxiv.org/abs/2010.09990.
U.S. FDA (CDER). Physiologically Based Pharmacokinetic Analyses — Format and Content. Guidance for Industry, September 2018; docket FDA-2016-D-3969.
Liu L-n, Jin H-y, Ke Z, Xu W-y, Sun L, Ma S-c. A strategy for quality control of ginkgo biloba preparations based on UPLC fingerprint analysis and multi-component separation combined with quantitative analysis. Chin Med. 2022;17:72, Table 2. doi.org/10.1186/s13020-022-00618-3.
Kennedy MC, O’Hagan A. Predicting the output from a complex computer code when fast approximations are available. Biometrika. 2000;87(1):1–13.
Jones DR, Schonlau M, Welch WJ. Efficient global optimization of expensive black-box functions. J Glob Optim. 1998;13:455–492.
Rasmussen CE, Williams CKI. Gaussian Processes for Machine Learning. MIT Press; 2006.
Psichogios DC, Ungar LH. A hybrid neural network–first principles approach to process modeling. AIChE J. 1992;38(10):1499–1511. doi.org/10.1002/aic.690381003.
MacGregor JF, Kourti T. Statistical process control of multivariate processes. Control Eng Pract. 1995;3(3):403–414.
Health information notice.These statements have not been evaluated by the Food and Drug Administration. Nothing on this site is intended to diagnose, treat, cure or prevent any disease, and nothing here is medical advice.
Read the full notice
The information is for general education only. It does not replace advice, diagnosis or treatment from a qualified health professional, or any medication a clinician has prescribed. Do not start, stop or change any medicine, supplement or herbal product because of something you read here. Talk to your doctor or pharmacist first, especially if you are pregnant or breastfeeding, have a medical condition, take any medicines, are preparing for surgery, or are caring for a child. Research findings, traditional uses and safety data are reported as their sources state them; they are not recommendations or claims about any product. If you think you may have a medical emergency, call your doctor or 911 at once.
EUTECNIQ Sciences sells no supplements or health products today and receives nothing from any product or ingredient mentioned on this site; any commercial interest it later has in an ingredient will be stated on that ingredient’s page.
Ready to start a development project?
Tell us about an ingredient you want to specify, verify or license. Questions? Email [email protected]