

Technologies · Scientific Intelligence
Computational research
Desk studies of three botanical actives, curcumin, quercetin and berberine, carried from molecular structure through solubility, extraction, formulation and stability to human exposure. Each of the 60 figures states what kind of evidence it is and ships with its data and the script that produced it.
Published dataThese studies analyze published measurements and run calculations with open-source tools. EUTECNIQ has not yet measured these compounds; where a figure uses simulated data or assumed inputs, it says so.
This program at a glance
- 60
- figures, each with data, code and a status label
- 3
- compounds followed from structure to exposure
- 17
- figures that demonstrate a method on assumed inputs or plan an experiment
- 0
- EUTECNIQ laboratory measurements so far
Status of the research
Six kinds of work, kept apart so none is mistaken for another.
The 60 figures are grouped by what they are. None of them shows that a trained Large Botanical Model exists.
| Kind of work | What is in it | Count |
|---|---|---|
| Completed computational research | Figures labeled Computed (20) and Benchmark simulation (1); the November 2026 surrogate benchmark on the platform page | 21 figures + 1 benchmark |
| Literature-based models and reanalyses | Measured (1, re-plotted), Literature-derived (6), Calibrated (10) and Predicted (5) | 22 figures |
| Illustrative numerical simulations | Methods shown on a simulator with assumed inputs | 15 figures |
| Proposed platform components | Knowledge graph, data pipelines, specialized predictive models; see the maturity register | None built |
| Planned laboratory validation | Figures labeled Planned (2) and the six measurements below | 2 figures · 6 measurements |
| Commercially operational products | None. EUTECNIQ Atlas and the supplement calculator are free public tools, separate from the platform. | 0 |
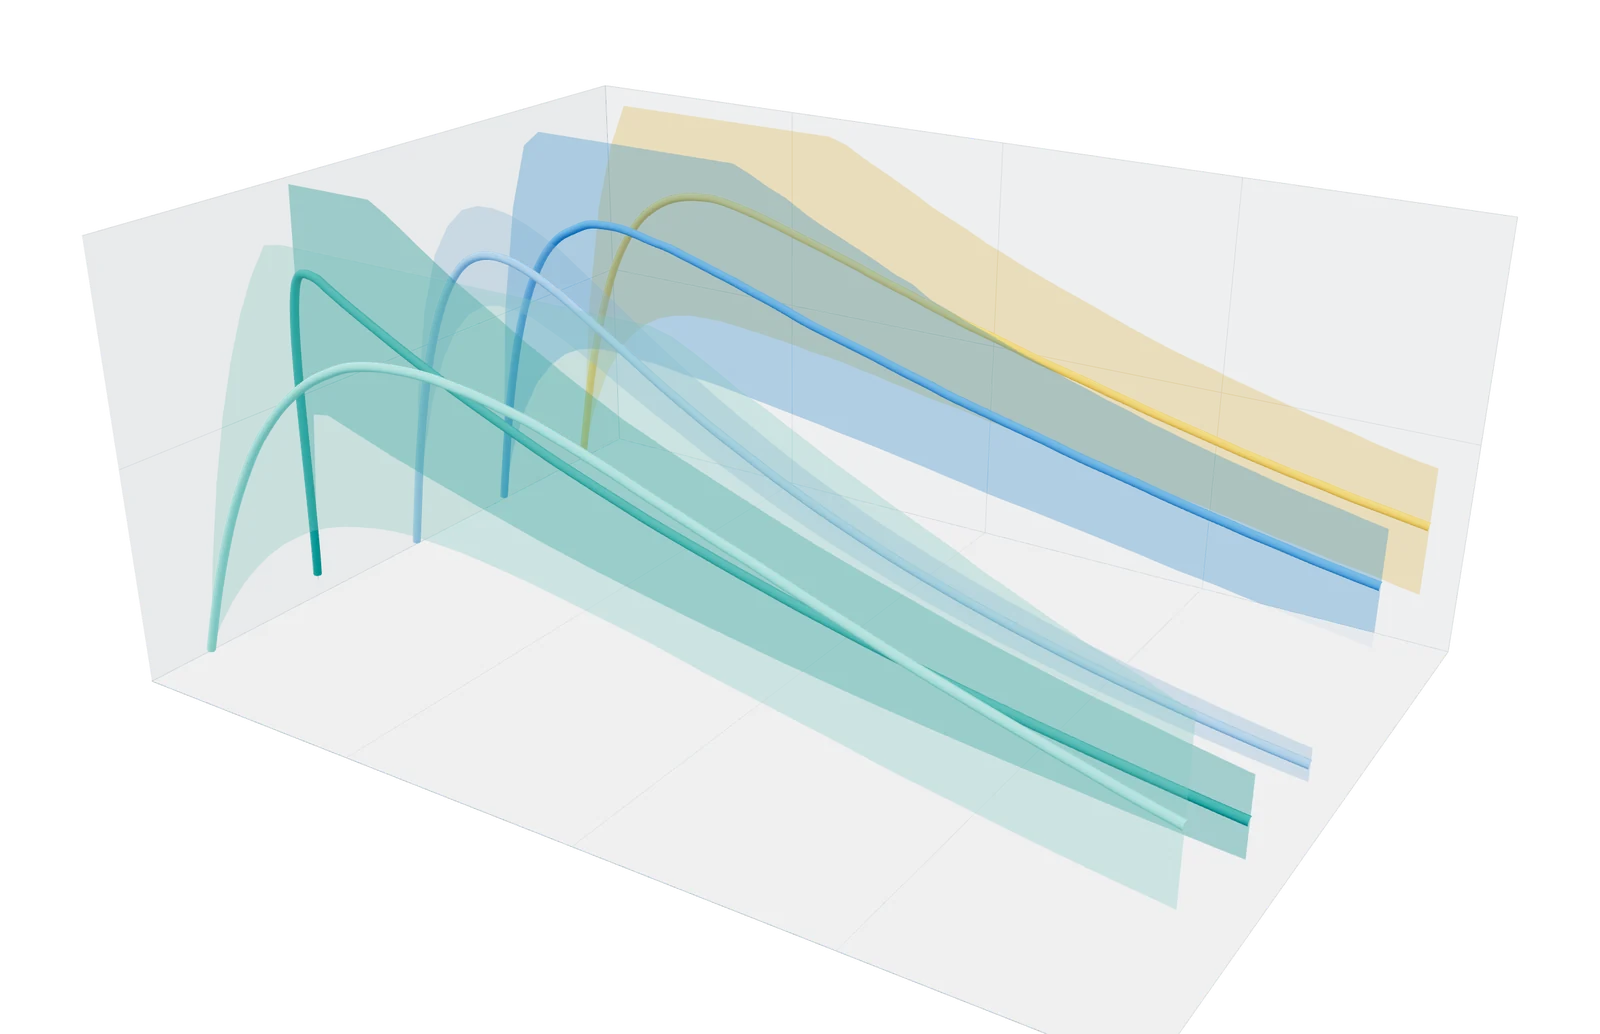
- 1 Line: posterior median
- 2 Band: 90% credible interval
Data: FIG 032. Posterior median and 90% interval of the typical-subject curve for each published dataset (PyMC NUTS, 4 chains × 2,000 draws). Each curve is scaled to its own peak, so heights are not comparable across ribbons.

- 1 Dose
- 2 Plasma height: posterior median concentration at each sampling time
- 3 Bayesian model: median and 90% band; dots are the tubes
Data: FIG 032, curcumin conjugates: posterior median plasma concentration of the typical subject at each time (PyMC, calibrated on Vareed et al., Cancer Epidemiol Biomarkers Prev 2008). Plasma height is scaled to the peak; the screen shows the median and 90% interval. Tubes and dose are schematic.
Part of the case for why EUTECNIQ is different.
Findings
What the calculations show so far
The most useful results are the ones that change what should be measured next.
- A conformer search of 100 starts, the size of an earlier version of this calculation, stops 0.49 kcal/mol above the lowest diketo curcumin minimum; 1,500 starts reach it at start 539. Quercetin and berberine reproduce the earlier minima to four decimals. FIG 004
- In explicit water, curcumin's intramolecular enol hydrogen bond stays intact (O···O under 2.8 Å) in 88% of frames across 2 replicates, so that hydroxyl is largely unavailable to the solvent. FIG 009
- Seven published first pKa values for quercetin, from 5.81 to 8.45, put its neutral fraction at pH 6.8 anywhere between 0.09 and 0.98. Any pH-dependent model of quercetin inherits that spread. FIG 007
- Two published aqueous solubilities of quercetin disagree by nearly four orders of magnitude, while organic-solvent data from different laboratories agree within a few percent. FIG 014
- Of the human studies compiled for FIG 033, only one reports quantifiable parent curcumin; in it, unconjugated curcumin is about 0.3% of total curcumin exposure. Claims built on total curcumin describe conjugates. FIG 033
- Reported half-lives of curcumin near pH 7 and body temperature run from about 9 minutes in phosphate buffer to several hours in protein-containing media. FIG 026
- Animal formulation studies report 1.6- to 4.1-fold exposure gains for berberine and quercetin, but per mg/kg their reference arms report about 70 (rat) and 16,000 (rabbit) times the peak concentration of the human berberine study. FIG 029
- A re-analysis of a published nine-run quercetin dispersion design finds neither factor significant at the 5% level, although the paper ranks them. FIG 024
- Berberine's published summary data fit fast absorption with slow elimination and the reverse equally well; intravenous or metabolite data are needed to separate them. FIG 038
Case studies
Three molecules, three different development problems
Curcumin
Two tautomers, a conformer search that needed more than 500 starts to converge, solubility in 15 solvents, degradation kinetics and the parent-to-conjugate gap in human plasma.
Read the case studyCase studyQuercetin
An unresolved first pKa, conflicting water solubility, a published formulation design re-analyzed, and a Bayesian calibration of glycoside pharmacokinetics.
Read the case studyCase studyBerberine
A permanent cation whose problem is permeability more than solubility: excipient screens, a planned mixture design, and a population view of its variable exposure.
Read the case studyReading the figures
Every figure carries one of eight evidence labels
The label describes the figure as a whole. A calibrated model plotted against the measurements it was fitted to is calibrated, not measured.

| Label | Meaning | Figures |
|---|---|---|
| Measured | Values measured in a laboratory and reported by the cited source, re-plotted without modeling. | 1 |
| Literature-derived | Published values compiled or converted (for example, percentages to half-lives) with no fitted model. | 6 |
| Computed | Calculated here from defined inputs with a stated method: force-field energies, regressions, statistics. | 20 |
| Calibrated | A model whose parameters were fitted to published human or laboratory data, with posterior uncertainty. | 10 |
| Predicted | A calibrated or trained model applied beyond the data it was fitted to; read as a hypothesis. | 5 |
| Illustrative | A method demonstrated on a simulator or on simulated data with stated, assumed inputs. Not a result about any material. | 15 |
| Benchmark simulation | A numerical method checked against an accepted published reference solution. | 1 |
| Planned | An experiment or analysis designed but not yet carried out. | 2 |
Studies
Nine study areas, from force fields to quality systems
- Molecular structure7 figures
- Molecular dynamics3 figures
- Solubility and solvent selection5 figures
- Extraction and process7 figures
- Formulation and stability11 figures
- Pharmacokinetics10 figures
- Uncertainty and inference8 figures
- Optimization and design space5 figures
- Quality systems and validation4 figures
Methods, software versions, random seeds and verification checks are on the methods page.
Next measurements
Six laboratory measurements that would retire the largest uncertainties
These are planned experiments, not results. Each one is chosen because a calculation here cannot be settled without it.
| Quantity | Measurement | What it settles |
|---|---|---|
| Quercetin aqueous solubility | Shake-flask measurement at 25 and 37 °C with solid-form control (XRPD before and after), pH-stat, and HPLC-UV; three independent lots. | Resolves the nearly 10,000-fold disagreement in FIG 014. |
| Quercetin first pKa | Potentiometric and UV-metric titration in a co-solvent series extrapolated to water (Yasuda–Shedlovsky). | Fixes the speciation spread in FIG 007. |
| Curcumin fusion enthalpy | Differential scanning calorimetry of the crystal form used for solubility work. | Replaces the two estimated ideal-solubility bounds in FIG 013. |
| Tautomer and torsion energies | Density-functional calculations with implicit solvent on the MMFF94s minima of FIG 002. | Tests the force-field barriers in FIG 005 and compares the two curcumin tautomers on one energy scale. |
| Curcumin degradation in the product matrix | First-order kinetics at three or more temperatures in the actual formulation, with product identification by LC-MS. | Turns the broth-based surface of FIG 053 into a matrix-specific one. |
| Berberine formulation in people | A crossover pharmacokinetic study against a reference product, measuring parent berberine and its main metabolites. | The evidence gap marked in FIG 030. |
Scientific Intelligence · The Ingredient Engine · Computational science and AI
Health information notice. These statements have not been evaluated by the Food and Drug Administration. Nothing on this site is intended to diagnose, treat, cure or prevent any disease, and nothing here is medical advice.
Read the full notice
The information is for general education only. It does not replace advice, diagnosis or treatment from a qualified health professional, or any medication a clinician has prescribed. Do not start, stop or change any medicine, supplement or herbal product because of something you read here. Talk to your doctor or pharmacist first, especially if you are pregnant or breastfeeding, have a medical condition, take any medicines, are preparing for surgery, or are caring for a child. Research findings, traditional uses and safety data are reported as their sources state them; they are not recommendations or claims about any product. If you think you may have a medical emergency, call your doctor or 911 at once.
EUTECNIQ Sciences sells no supplements or health products today and receives nothing from any product or ingredient mentioned on this site; any commercial interest it later has in an ingredient will be stated on that ingredient’s page.