

Computational research · Case study
Quercetin: resolving conflicting data before modeling
For quercetin, the limiting factor is not the models but the data: its first pKa and its water solubility are each reported over a range wide enough to change any conclusion drawn from them.
Published dataEvery number on this page comes from a cited publication or from a calculation on published data; illustrative or planned figures are labeled.
The problem
What a developer needs to know, and what is usually reported instead
Quercetin aglycone is poorly soluble and extensively conjugated, and glycoside forms behave differently in people. Before a formulation can be designed, two basic quantities have to be known: how much dissolves in water and how much is ionized at intestinal pH. This case study shows how far the published values disagree and what a calibrated pharmacokinetic model can extract from the human data that exist.
Results
What the computations show
Ionization
Seven published first pKa values from 5.81 to 8.45 place the neutral fraction at pH 6.8 between about 0.09 and 0.98. FIG 007
Hydration
Explicit-water simulations of the neutral aglycone resolve the water shell around each of its five hydroxyl groups and its carbonyl. FIG 008 FIG 009
Solubility
Two published water solubilities differ nearly 10,000-fold; an independent 37 °C value falls between them. FIG 014 FIG 028
Solvent space
The published group-contribution Hansen center orders the organic solvents only weakly and cannot be tested in water. FIG 012
Figures
The evidence, figure by figure
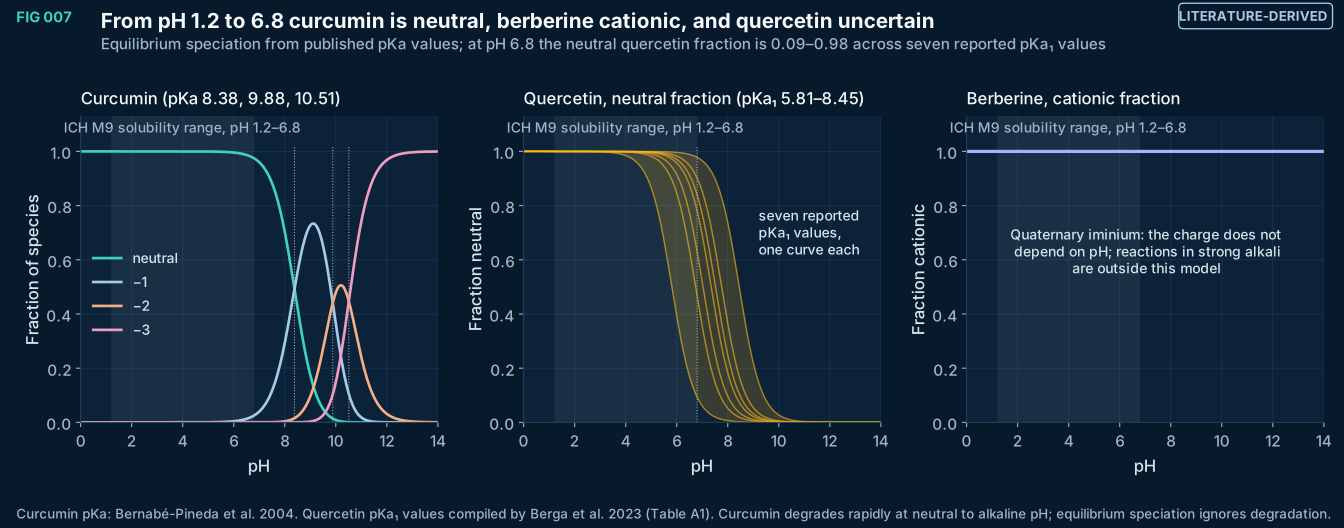
FIG 007Literature-derived
Equilibrium speciation versus pH. Curcumin (macroscopic pKa 8.38, 9.88, 10.51) is 97% neutral at pH 6.8. Seven published values of quercetin's first pKa (5.81 to 8.45) put its neutral fraction at pH 6.8 anywhere from 0.09 to 0.98. Berberine is a quaternary cation at every pH shown.
Method, sources and limits
- Method
- Henderson–Hasselbalch macroscopic speciation, sequential pKa values; quercetin first deprotonation only.
- Sources and code
- Curcumin: Bernabé-Pineda M et al. Spectrochim Acta A 2004;60:1091–1097, doi:10.1016/S1386-1425(03)00342-1. Quercetin: Berga M et al. Pharmaceuticals 2023;16(10):1407, Table A1, doi:10.3390/ph16101407. pH range: ICH M9 (2019) biopharmaceutics classification, solubility over pH 1.2–6.8. Script 01_molecular_structures/s01_figures.py.
- Supports
- Which species should be modeled in each pH region; the need to resolve quercetin's pKa experimentally before pH-dependent modeling.
- Does not support
- Solubility at a given pH; absorption predictions.
- Limitations
- Macroscopic pKa values; microspecies and tautomer-specific ionization are not resolved.
- Temperature and ionic strength of the source measurements differ.
- Degradation of curcumin at pH ≥ 7 is not modeled.
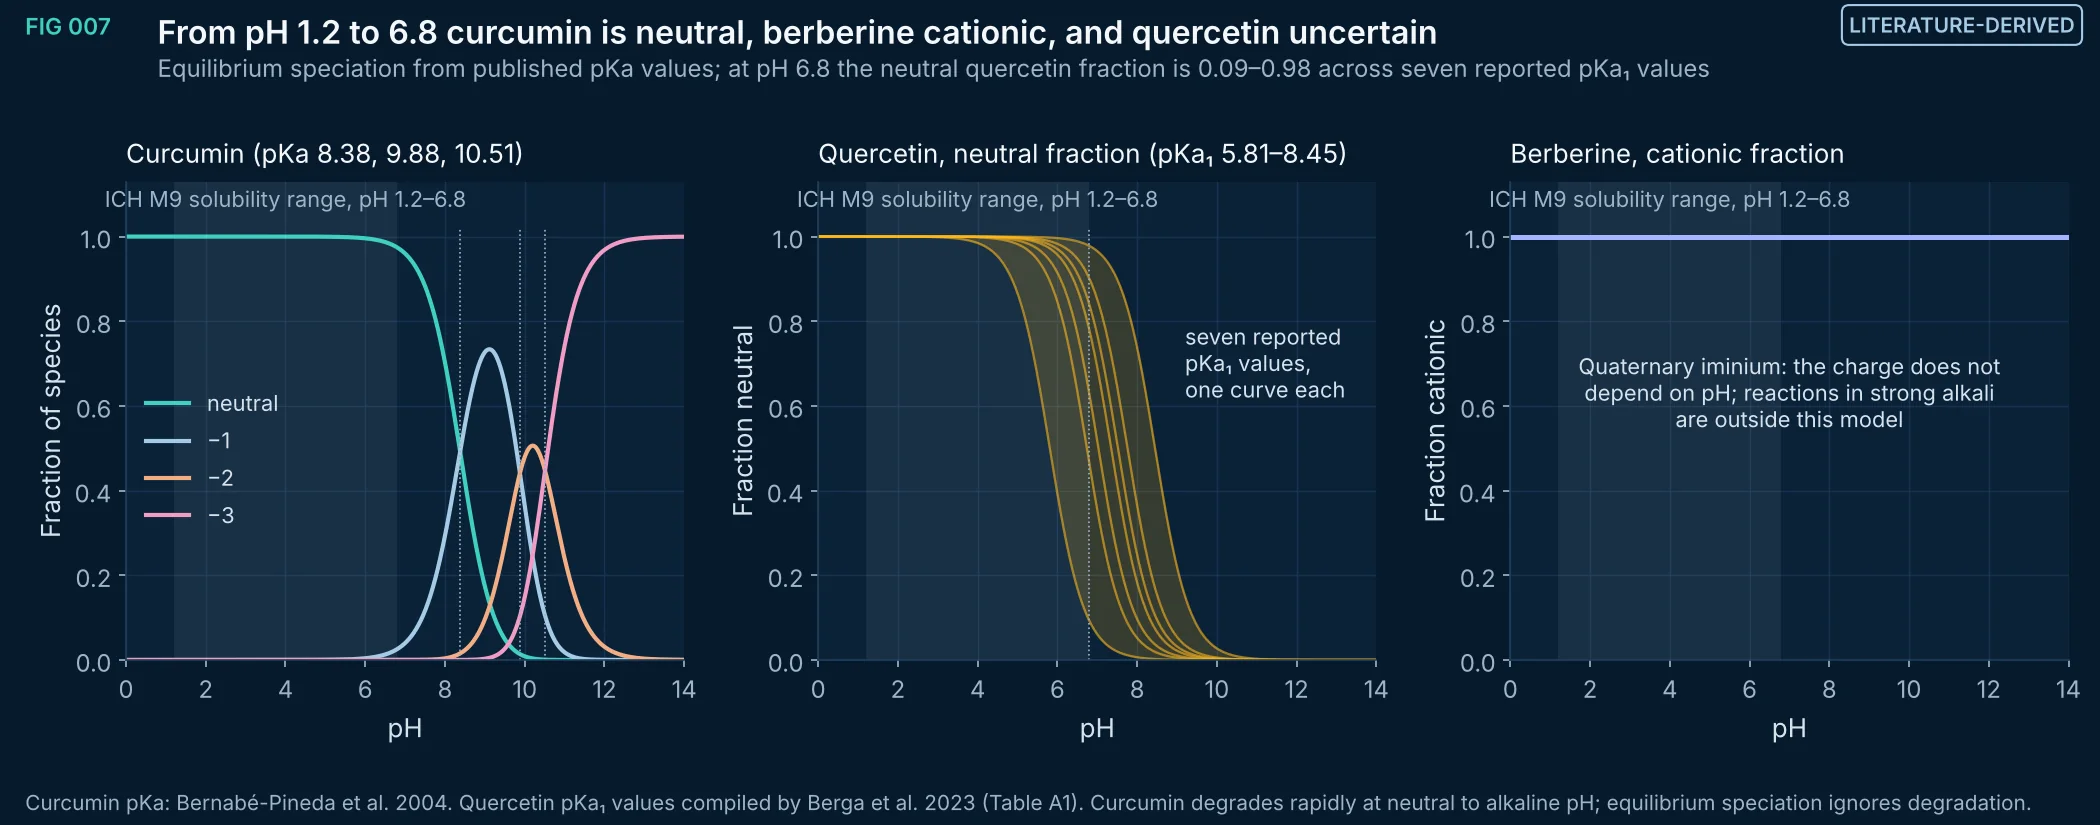
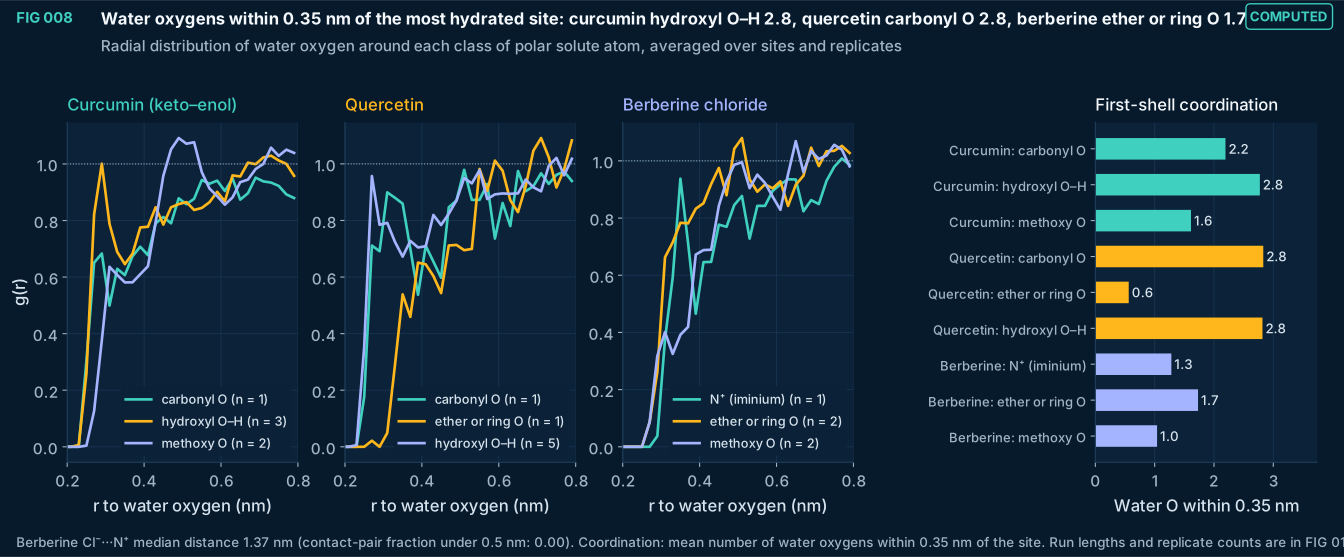
FIG 008Computed
Solvation structure from explicit-solvent molecular dynamics with MMFF94s: radial distribution functions of water oxygen around the polar atoms of each solute, and first-shell coordination numbers. Coordination differs several-fold between site types; in curcumin the hydroxyl that takes part in the intramolecular enol hydrogen bond is partly shielded from water (FIG 009). These are the solute–solvent contacts that continuum solubility models average away.
Method, sources and limits
- Method
- g(r) from minimum-image distances in the cubic NPT box, frame-wise box length, 0.02 nm bins; averaged over equivalent sites and over replicates; coordination counted within 0.35 nm.
- Sources and code
- MMFF94s in OpenMM 8.6.1 (custom forces verified against RDKit), PME, Langevin 300 K, Monte Carlo barostat 1 bar, 2 fs; frames every 0.5 ps. Scripts 02_force_fields_and_MD/md_run.py and md_figs.py.
- Supports
- Which solute sites dominate hydration, as input to solubility and permeability reasoning.
- Does not support
- Quantitative hydration free energies or solubilities.
- Limitations
- Short trajectories (tens of picoseconds per replicate): adequate for first-shell structure and fast hydrogen-bond dynamics, not for conformational sampling or slow events.
- MMFF94s with its own water parameters, not a dedicated water model such as TIP3P or OPC; water density and structure differ from experiment.
- One solute molecule per box; no concentration, aggregation or counter-ion pairing statistics beyond what a single ion shows.
Vector (SVG) · Full-size image · data (coordination) (CSV) · data (rdf) (CSV)
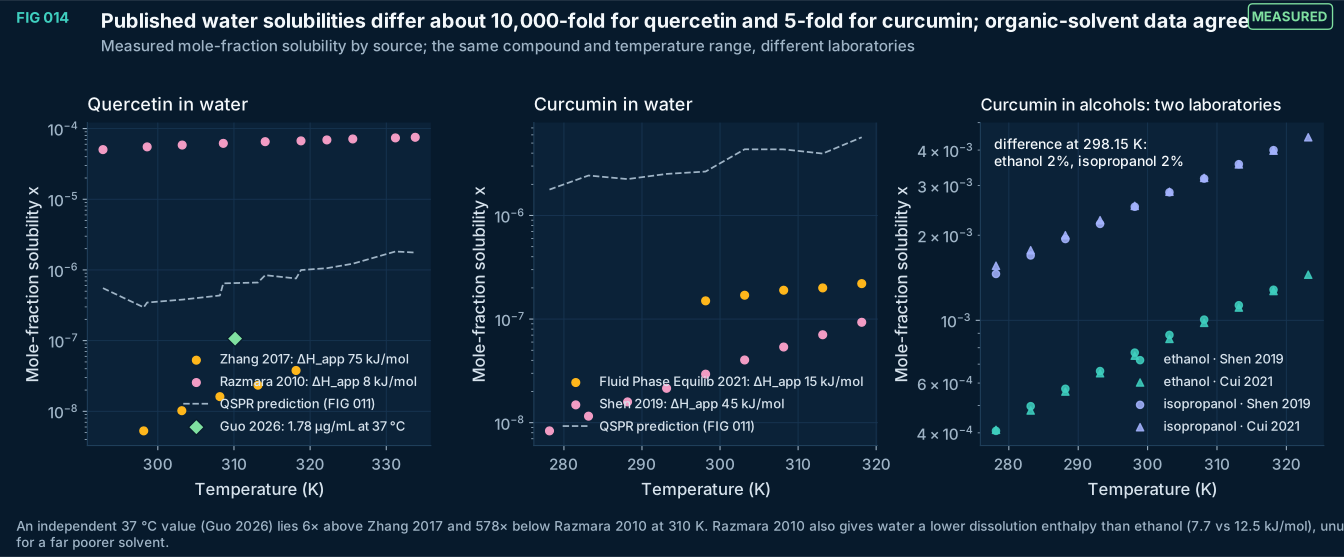
FIG 014Measured
Water solubility of quercetin from two laboratories differs about 10,000-fold at 298.15 K (van 't Hoff interpolation), and that of curcumin about 5-fold, while two laboratories' curcumin data in ethanol and isopropanol agree within a few percent. Water solubility is the quantity most often quoted for these compounds and the least reproducible here.
Method, sources and limits
- Method
- Published measurements as compiled in BigSolDB 2.0; ratios from per-source van 't Hoff fits at 298.15 K; QSPR line from FIG 011 for reference.
- Sources and code
- Krasnov L. et al. BigSolDB 2.0, Zenodo (CSV v2.0; SHA256 879f55f3…). Curcumin rows: Cui et al. J Mol Liq 2021 (10.1016/j.molliq.2021.116795); Shen et al. J Chem Thermodyn 2019 (10.1016/j.jct.2018.11.022); Fluid Phase Equilib 2021 (10.1016/j.fluid.2020.112917). Quercetin rows: Razmara et al. J Chem Eng Data 2010 (10.1021/je9010757); Zhang et al. J Mol Liq 2017 (10.1016/j.molliq.2016.11.036); Montenegro et al. J Chem Thermodyn 2025;203:107434 (10.1016/j.jct.2024.107434). Independent 37 °C quercetin value: Guo et al. Pharmaceuticals 2026;19(10):1625, doi:10.3390/ph19101625. Scripts 03_thermodynamics_CAMD/thermo_compute.py and thermo_figs.py.
- Supports
- Treating aqueous solubility of both compounds as uncertain by orders of magnitude until remeasured under controlled solid form and pH.
- Does not support
- Choosing either published water value for formulation design.
- Limitations
- Sources differ in method (shake-flask, analytical finish), solid form and equilibration time; these details were not re-examined from the full texts.
- The QSPR line is itself trained on public data that include one of the conflicting series' peers and cannot arbitrate.
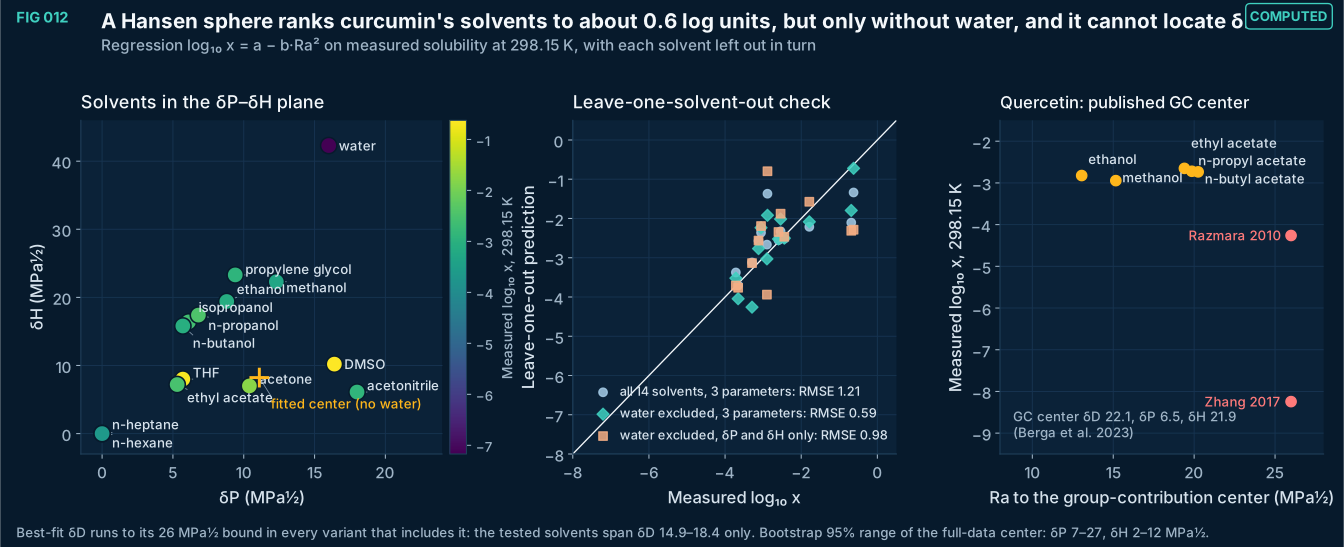
FIG 012Computed
Curcumin solubility at 298.15 K (van 't Hoff interpolation of the measured series) regressed on the Hansen distance Ra to a fitted center. Without water, leave-one-solvent-out RMSE is 0.59 log₁₀ units; including water it rises to 1.21. The dispersion coordinate δD is not identifiable from these solvents. For quercetin, the published group-contribution center orders the organic solvents only weakly and cannot be tested in water, where the two datasets disagree.
Method, sources and limits
- Method
- Least-squares fit of log₁₀ x = a − b·Ra², Ra² = 4(δD−δD₀)² + (δP−δP₀)² + (δH−δH₀)², multi-start; leave-one-out refits; 300-sample bootstrap over solvents. m-Xylene omitted (no Hansen values collected).
- Sources and code
- Krasnov L. et al. BigSolDB 2.0, Zenodo (CSV v2.0; SHA256 879f55f3…). Curcumin rows: Cui et al. J Mol Liq 2021 (10.1016/j.molliq.2021.116795); Shen et al. J Chem Thermodyn 2019 (10.1016/j.jct.2018.11.022); Fluid Phase Equilib 2021 (10.1016/j.fluid.2020.112917). Quercetin rows: Razmara et al. J Chem Eng Data 2010 (10.1021/je9010757); Zhang et al. J Mol Liq 2017 (10.1016/j.molliq.2016.11.036); Montenegro et al. J Chem Thermodyn 2025;203:107434 (10.1016/j.jct.2024.107434). Hansen CM. Hansen Solubility Parameters: A User's Handbook, 2nd ed. CRC Press, 2007; n-hexane: Carré et al. 2024. Berga M et al. Pharmaceuticals 2023;16(10):1407, Table A3 (group-contribution estimate), doi:10.3390/ph16101407 Scripts 03_thermodynamics_CAMD/thermo_compute.py and thermo_figs.py.
- Supports
- Coarse solvent ranking; the need for solvents with higher δD to constrain the center.
- Does not support
- A definitive Hansen parameter set for curcumin or quercetin.
- Prediction of water solubility.
- Limitations
- A Hansen sphere is a correlative model; it ignores temperature, solute melting and specific association.
- Only 13–14 solvents; the center is poorly constrained (wide bootstrap range).
- Values at 298.15 K are interpolated from each published series; where two sources exist their logarithms are averaged.
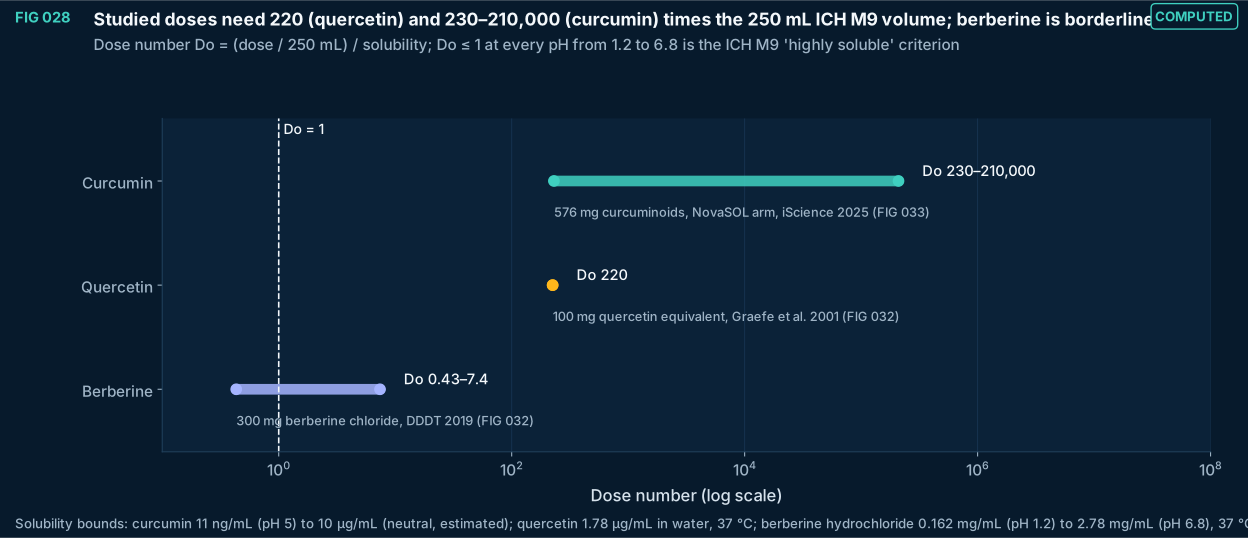
FIG 028Computed
Dose numbers for the main doses in the human studies cited in this note (curcumin about 570 mg, quercetin 100 mg, berberine chloride 300 mg); higher curcumin doses in the cited studies (2.28 g; 10–12 g) give proportionally larger values. Berberine chloride at 300 mg exceeds Do = 1 at pH 1.2 but not at pH 6.8; quercetin and curcumin exceed it by two to five orders of magnitude, so formulation can change dissolution but cannot make these doses dissolve in gastrointestinal volumes as free molecules.
Method, sources and limits
- Method
- Do = (D/250 mL)/Cs (ICH M9 volume); bounds from the lowest and highest solubility values cited.
- Sources and code
- 11 ng/mL at pH 5 (Brotons-Canto et al. Pharmaceutics 2021;13:361, quoting Tønnesen et al. 2002); 1–10 µg/mL estimated at neutral pH (Nelson et al. J Med Chem 2017); 1.78 ± 0.17 µg/mL in water at 37 °C (Guo et al. 2026); berberine hydrochloride 0.162 mg/mL at pH 1.2 to 2.78 mg/mL at pH 6.8, 37 °C (Chen et al. 2024). ICH M9 (2019) Biopharmaceutics Classification System-based biowaivers. Script 05_delivery_QbD/form_figs.py; transcriptions in form_data.py; source XML in 00_provenance/literature.
- Supports
- Why curcumin and quercetin need solubilizing or supersaturating formulations.
- Does not support
- A BCS classification for any product.
- Limitations
- Solubility values come from different laboratories, temperatures and media; biorelevant media with bile salts raise solubility of lipophilic compounds.
- Dose number ignores permeability and metabolism.
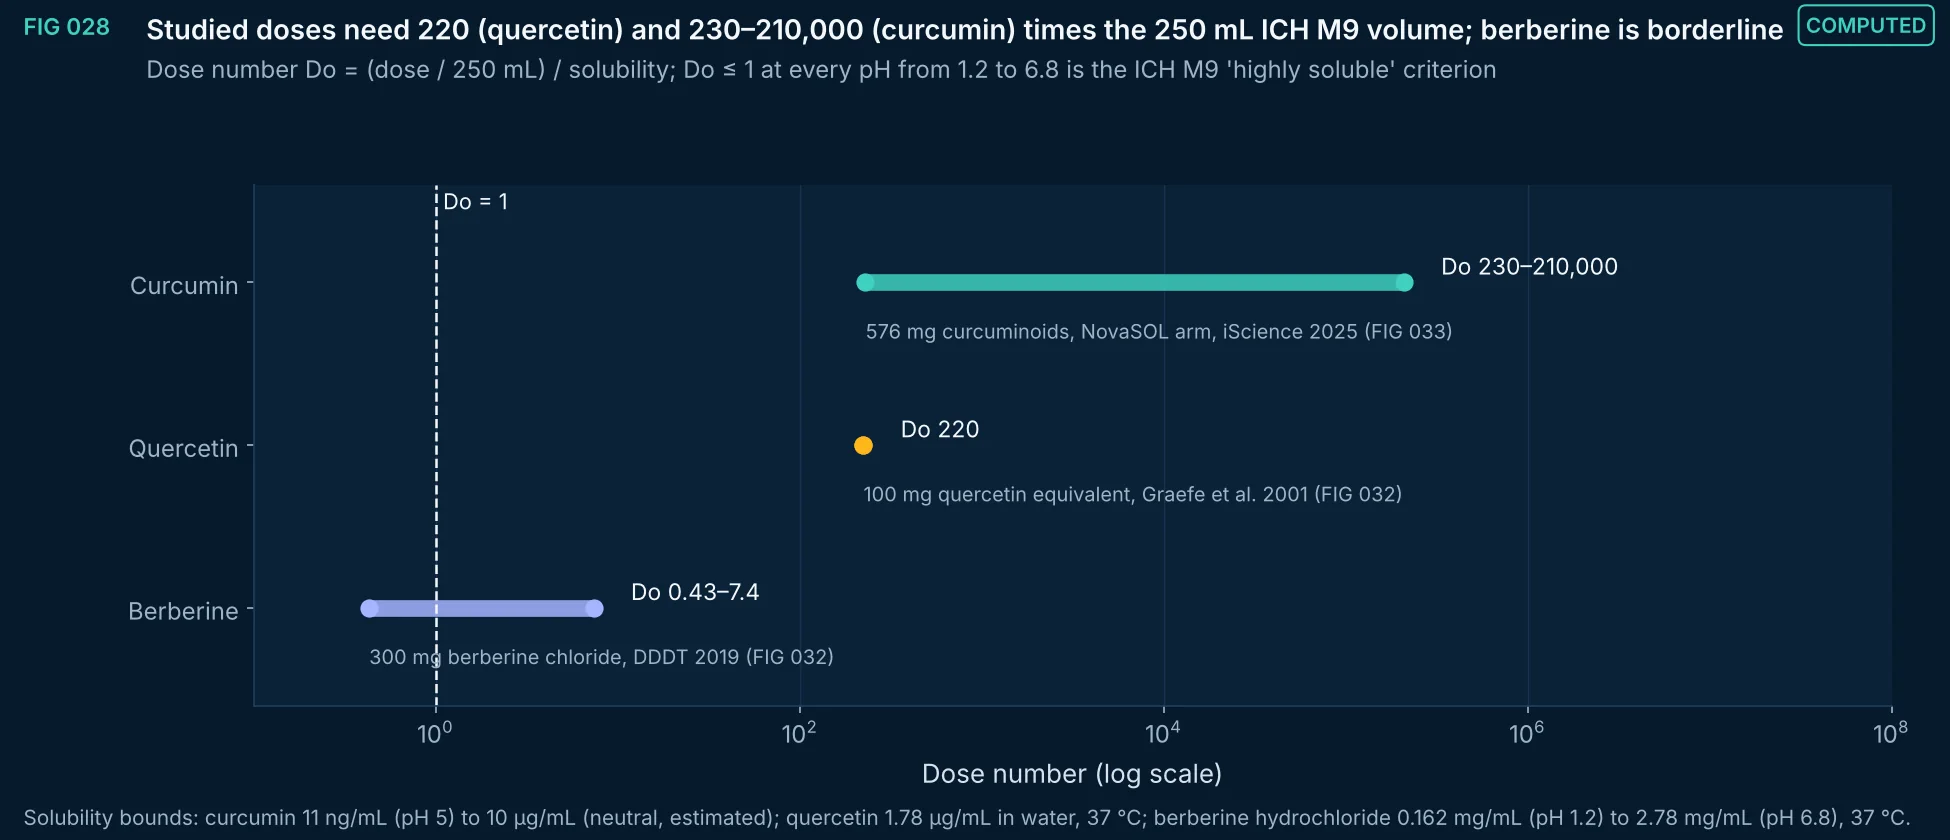
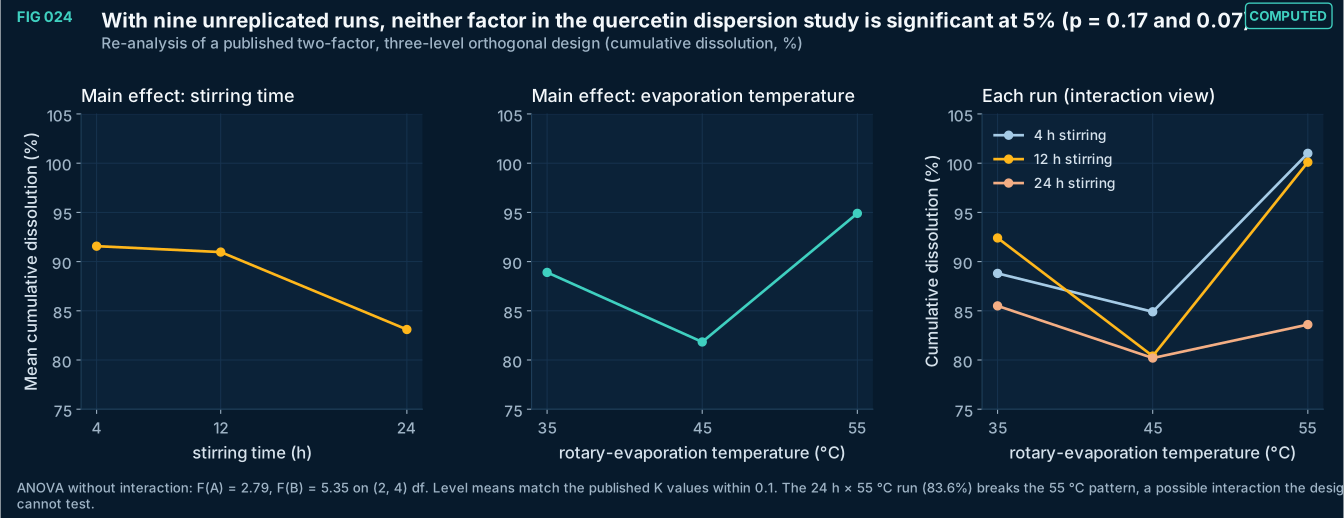
FIG 024Computed
Main-effect and run-level plots for the published L9-type design (stirring time × rotary-evaporation temperature) of quercetin solid dispersions. The authors ranked factors by range (8.5 and 6.0 points). A two-way ANOVA on the same nine values gives p = 0.17 for stirring time and p = 0.07 for temperature, so the ranking is not supported statistically; the 4 h, 55 °C condition is a reasonable choice but not a demonstrated optimum.
Method, sources and limits
- Method
- Two-way additive ANOVA (residual df 4) on the published responses; level means compared with the published K values.
- Sources and code
- Guo et al. Formulation development and characterization of quercetin solid dispersions with integrated in vitro release and in vivo pharmacokinetic assessment. Pharmaceuticals 2026;19(10):1625. doi:10.3390/ph19101625. PMID 42943322, PMC13708282 Script 05_delivery_QbD/form_figs.py; transcriptions in form_data.py; source XML in 00_provenance/literature.
- Supports
- Replicated or response-surface designs before claiming an optimum.
- Does not support
- Any conclusion that either factor has no effect.
- Limitations
- No replicates: interaction and pure error are confounded in the residual.
- Responses are single cumulative-dissolution values at one time point.
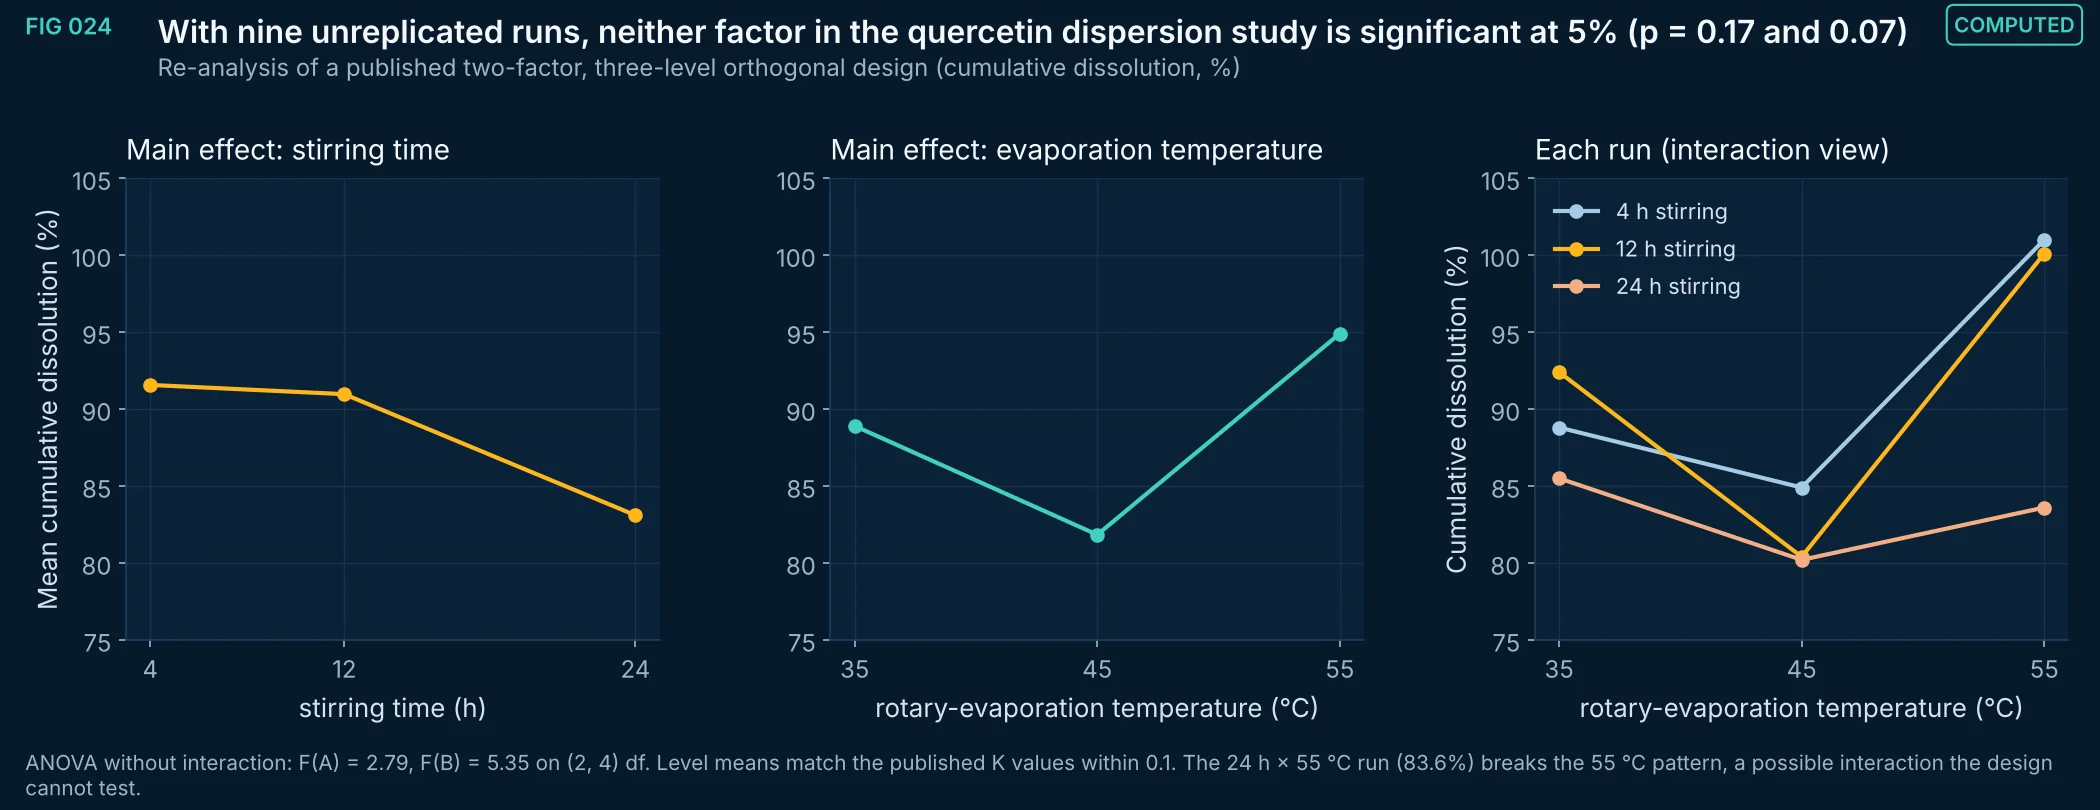
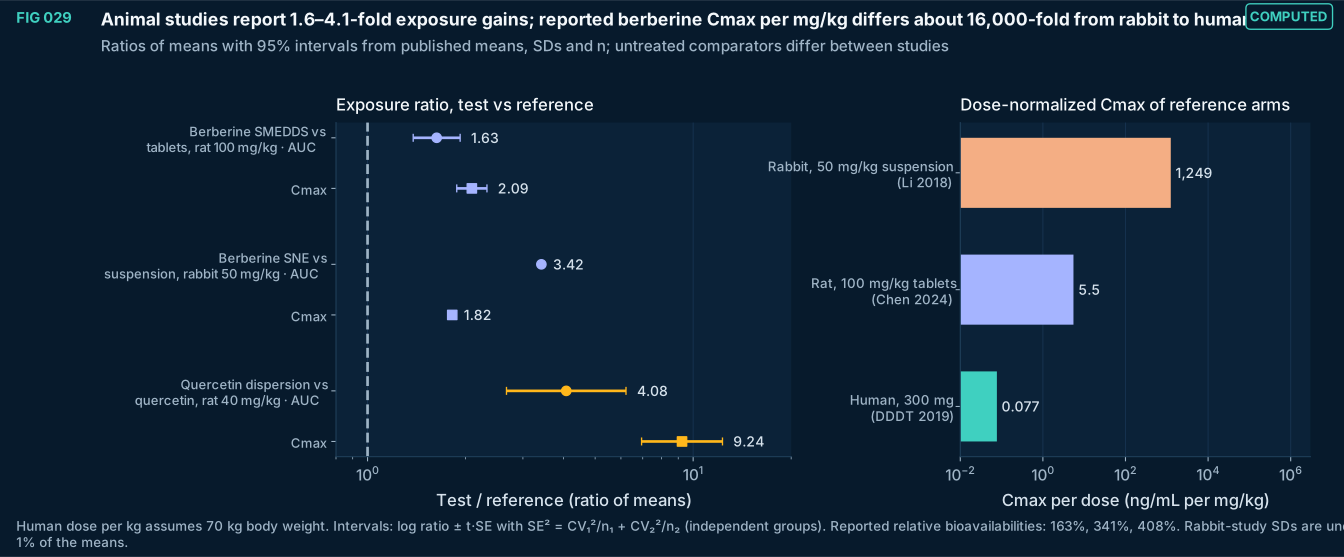
FIG 029Computed
Exposure ratios of formulated against reference arms in three animal studies (two berberine, one quercetin), with 95% intervals reconstructed from the published summary statistics, and the dose-normalized peak concentration of each berberine study's reference arm. Per mg/kg, the rat reference arm reports about 71 times and the rabbit arm about 16,000 times the human peak concentration, which signals large differences in species, dose, assay or analyte; fold changes from one model do not transfer to people.
Method, sources and limits
- Method
- Ratio of means with log-normal delta-method interval (t with n₁+n₂−2 df); dose normalization by mg/kg.
- Sources and code
- Chen X et al. Self-microemulsifying drug delivery system to enhance oral bioavailability of berberine hydrochloride in rats. Pharmaceutics 2024;16(9):1116. doi:10.3390/pharmaceutics16091116. PMID 39339154, PMC11435259 Li J et al. Self-nanoemulsifying system improves oral absorption and enhances anti-acute myeloid leukemia activity of berberine. J Nanobiotechnology 2018;16:76. doi:10.1186/s12951-018-0402-x. PMID 30290822, PMC6172716 Guo et al. Formulation development and characterization of quercetin solid dispersions with integrated in vitro release and in vivo pharmacokinetic assessment. Pharmaceuticals 2026;19(10):1625. doi:10.3390/ph19101625. PMID 42943322, PMC13708282 Human berberine: DDDT 2019;13:129 (FIG 032). Script 05_delivery_QbD/form_figs.py; transcriptions in form_data.py; source XML in 00_provenance/literature.
- Supports
- Treating animal fold changes as hypothesis-generating; the need for human data on any formulation claim.
- Does not support
- Any human bioavailability claim for these formulations.
- Limitations
- Summary statistics only; individual data unavailable.
- Different comparators (tablets, suspension, unformulated powder) and assays (HPLC-UV vs UPLC-MS/MS).
- Human body weight assumed.
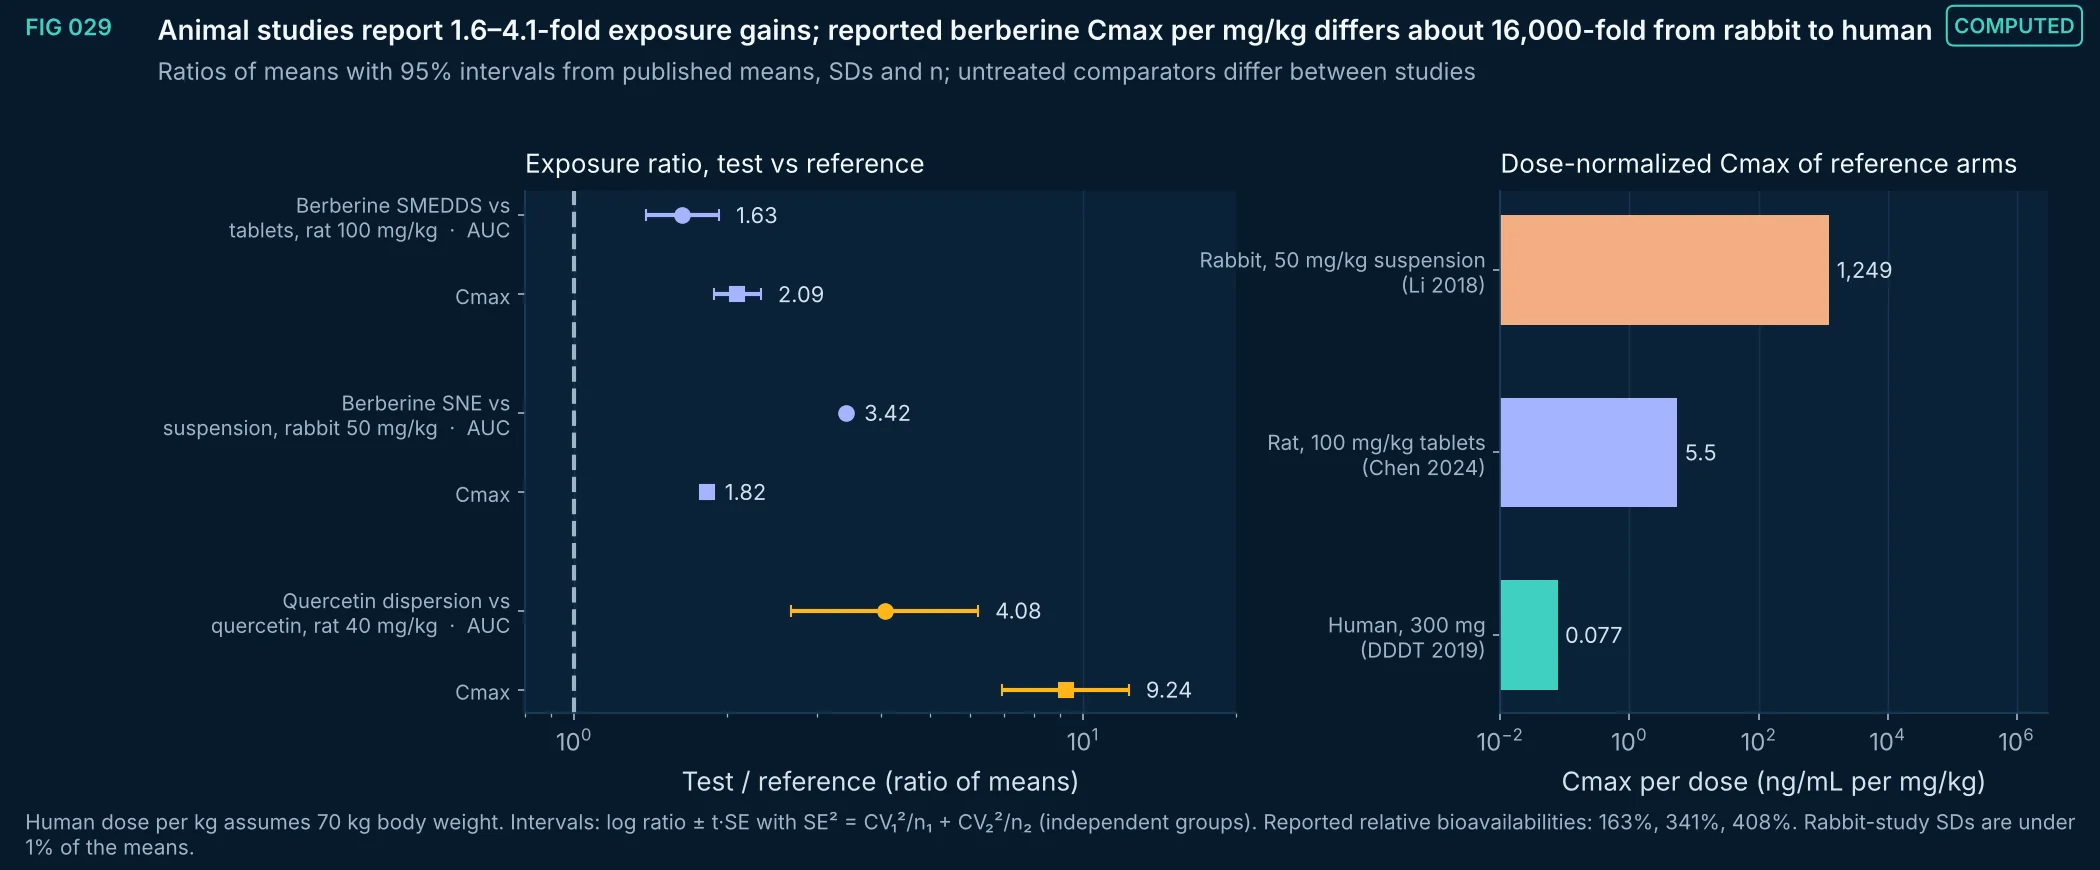
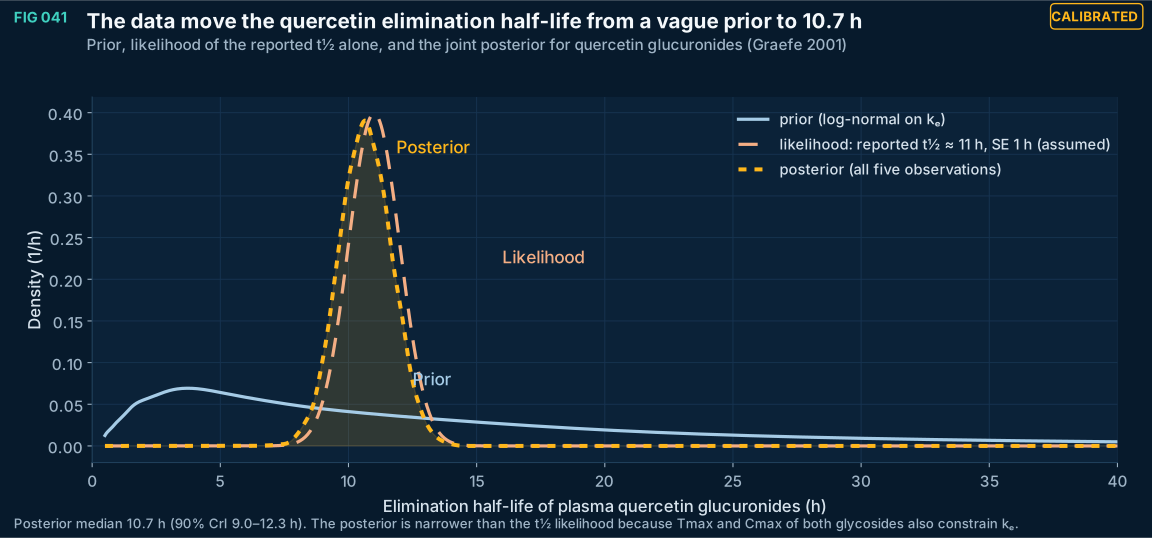
FIG 041Calibrated
Fill the empty lists (e.g., FIG 041 Supports: 'How much the single reported t½ constrains the model'; Does not support: 'A half-life for free quercetin') or hide headings with no items.
Method, sources and limits
- Method
- Kernel density of prior predictive and posterior draws; the likelihood curve is the normalized normal likelihood of the t½ observation alone.
- Sources and code
- Data: Graefe et al., J Clin Pharmacol 2001;41:492–499 (n = 12 crossover).
- Supports
- Does not support
- Limitations
- The SE of the 'about 11 h' t½ is an assumption (1 h).
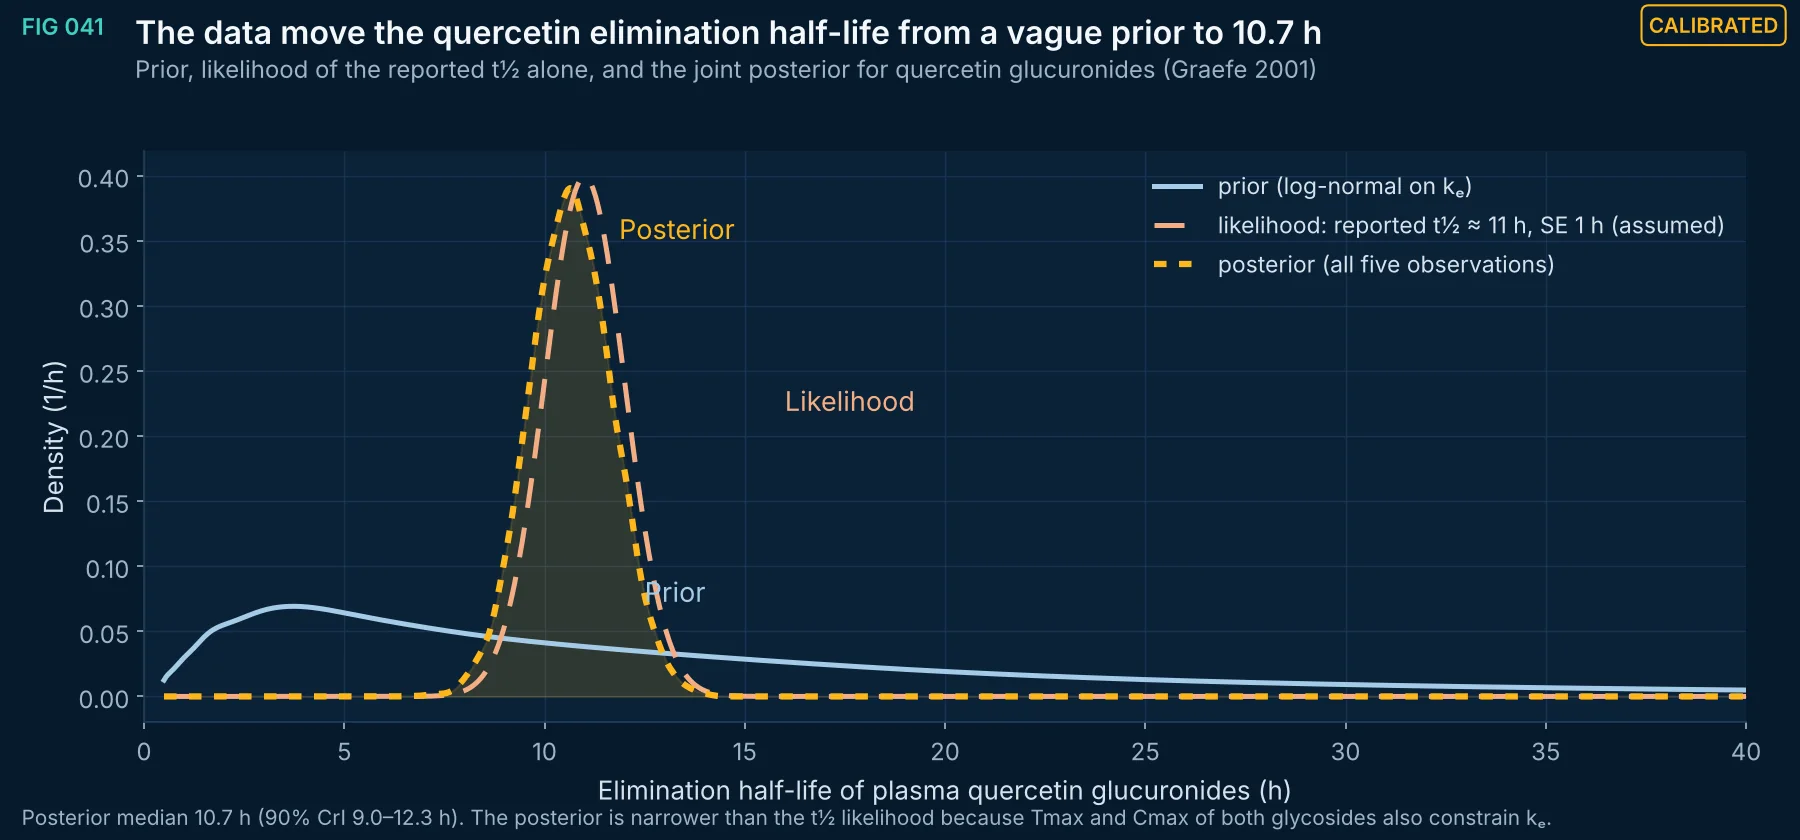
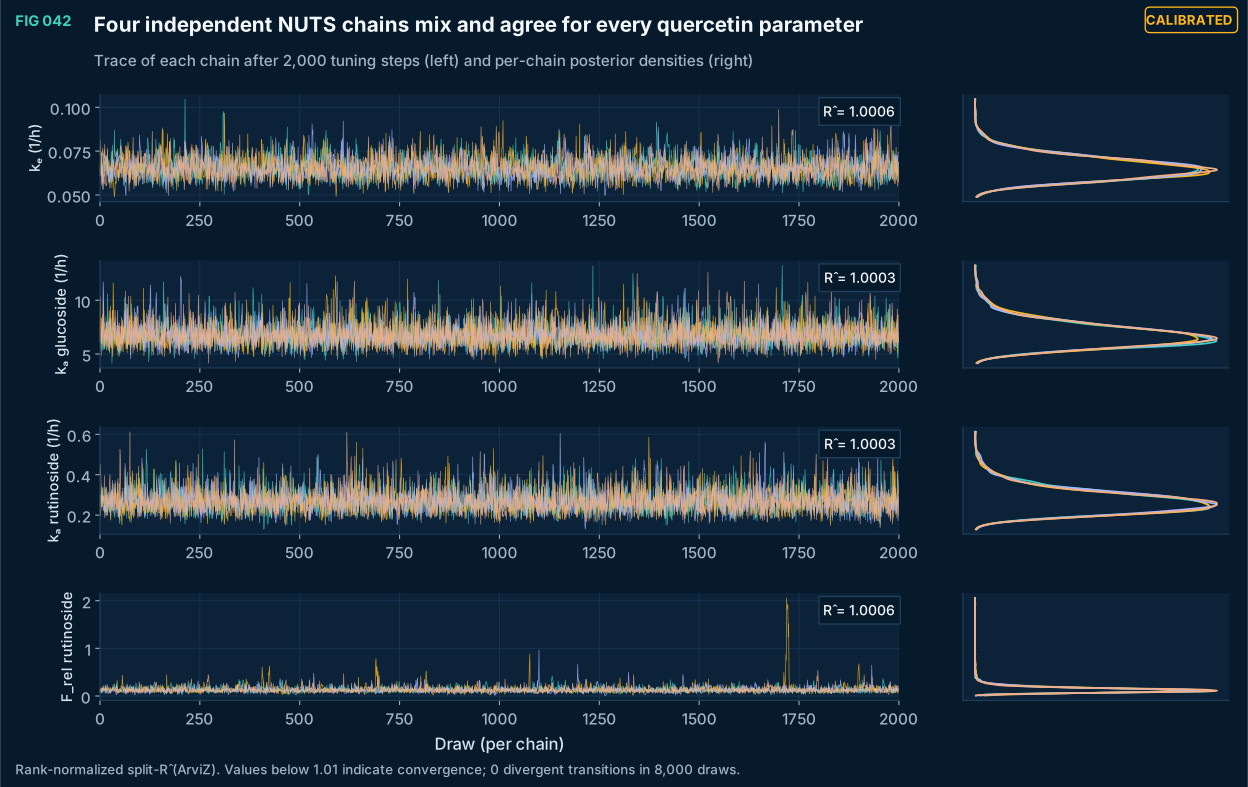
FIG 042Calibrated
Per-chain traces and densities of the quercetin model parameters.
Method, sources and limits
- Method
- PyMC NUTS, target acceptance 0.97, 4 chains.
- Sources and code
- Data: Graefe et al., J Clin Pharmacol 2001;41:492–499 (n = 12 crossover).
- Supports
- Does not support
- Limitations
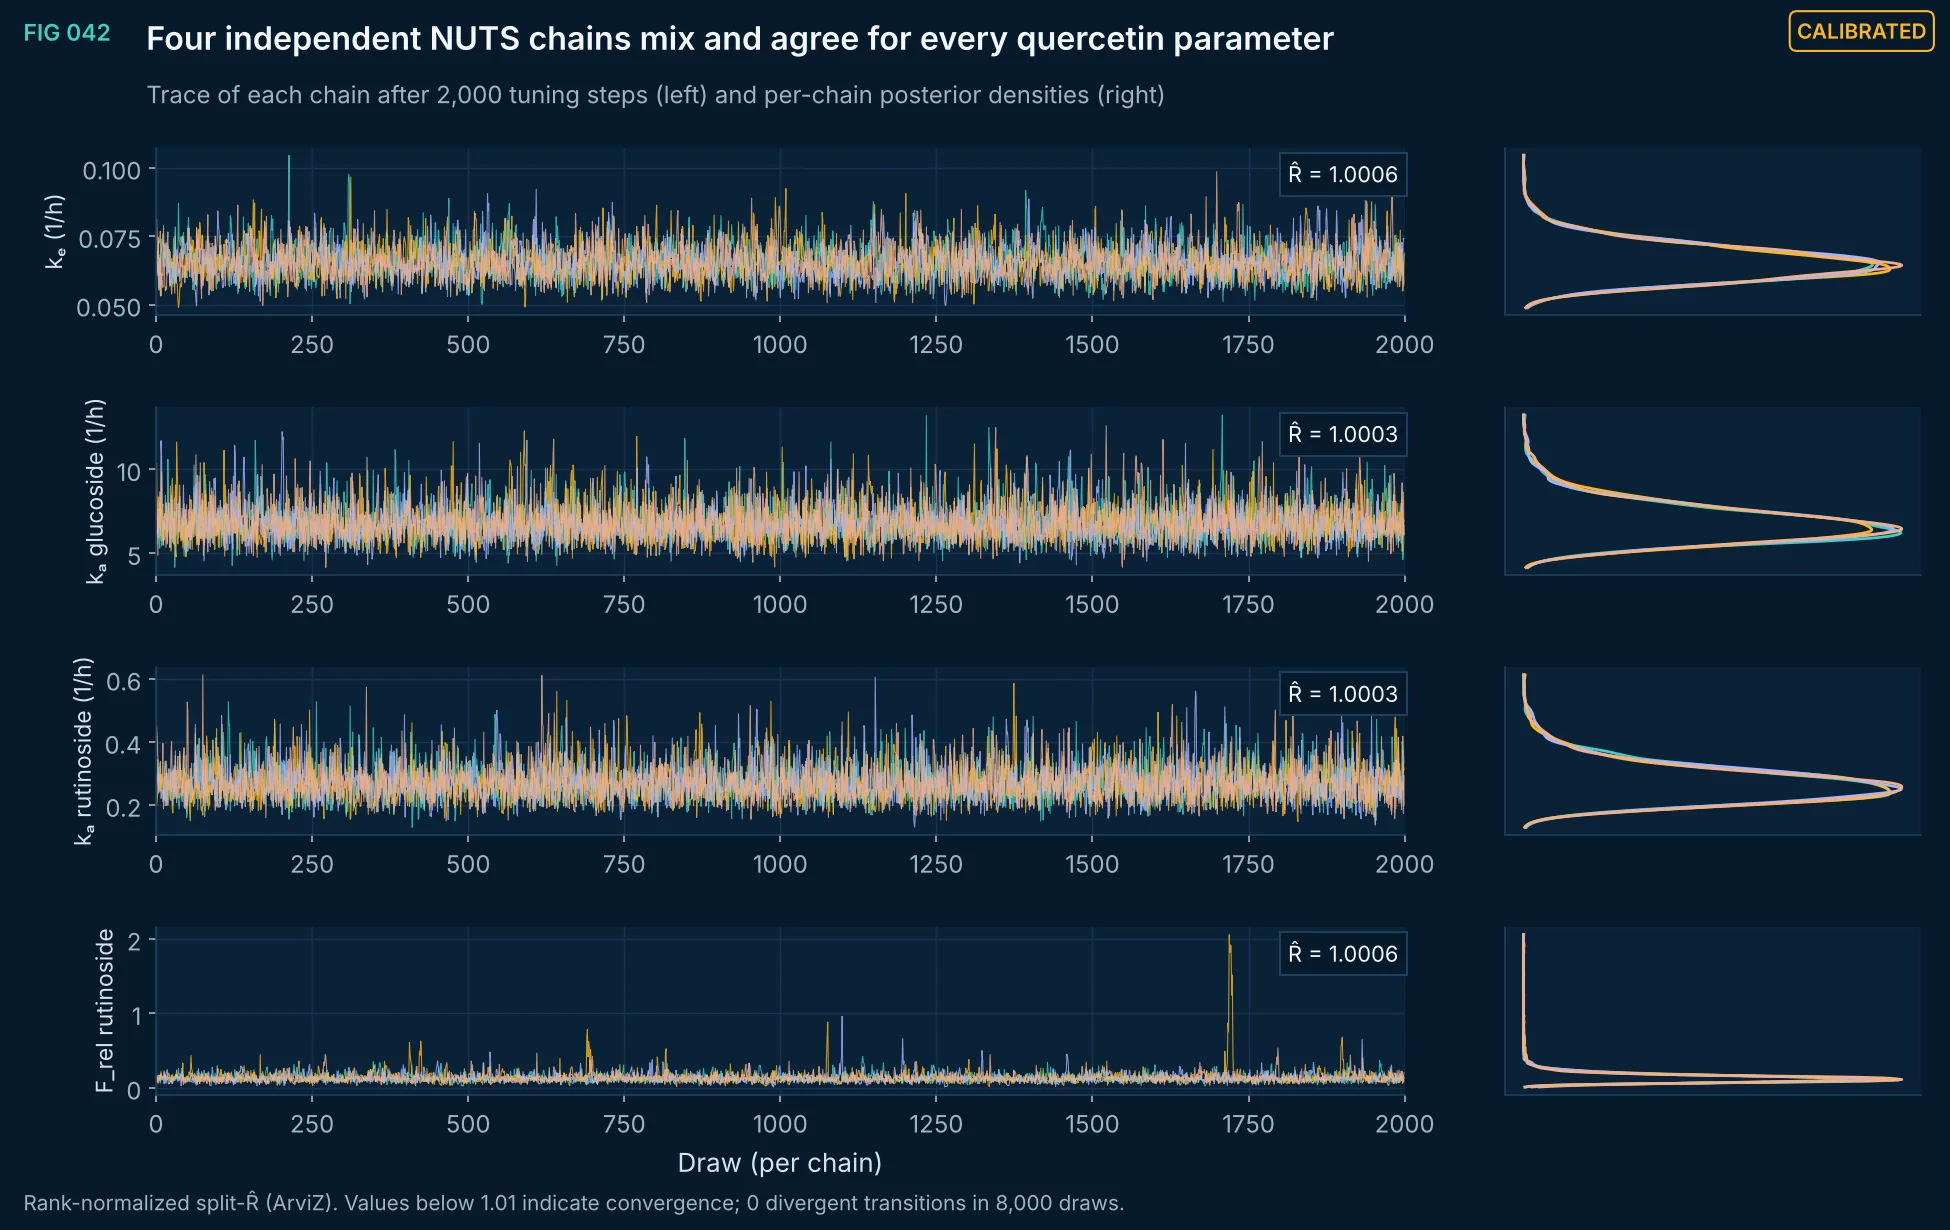
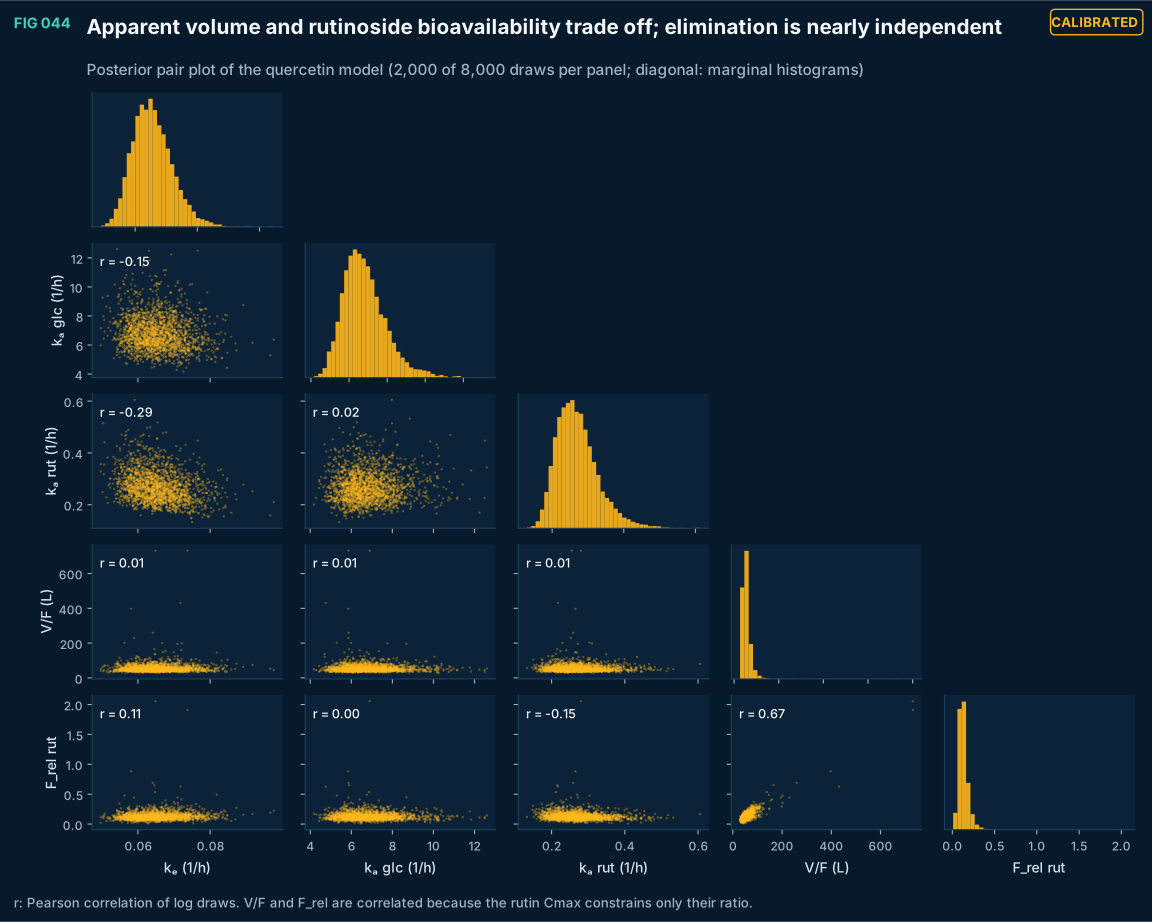
FIG 044Calibrated
Posterior pair plot of the quercetin PK parameters.
Method, sources and limits
- Method
- NUTS draws.
- Sources and code
- Data: Graefe et al., J Clin Pharmacol 2001;41:492–499 (n = 12 crossover).
- Supports
- Does not support
- Limitations
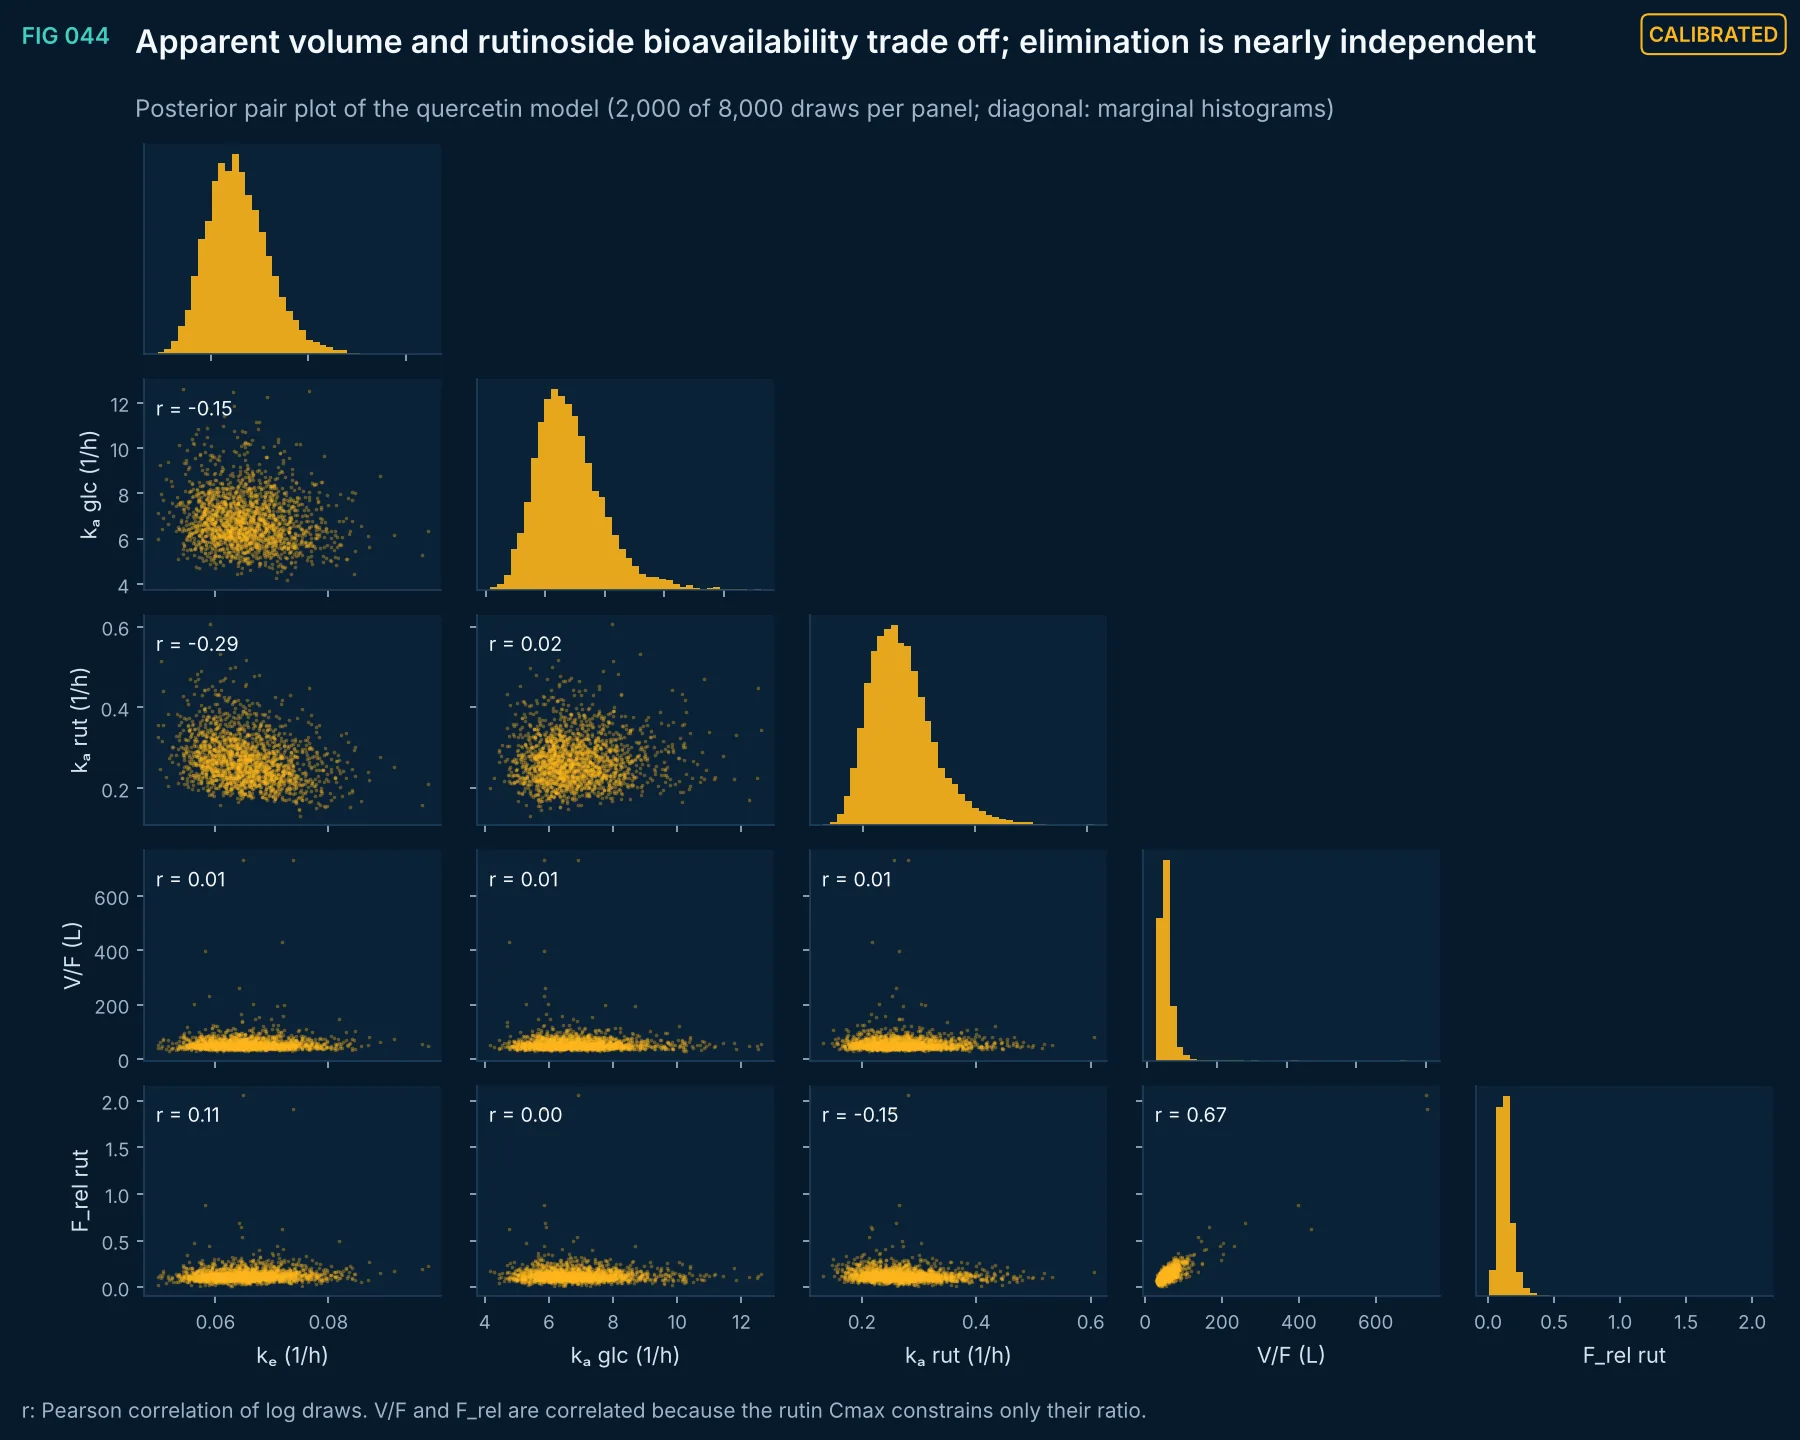
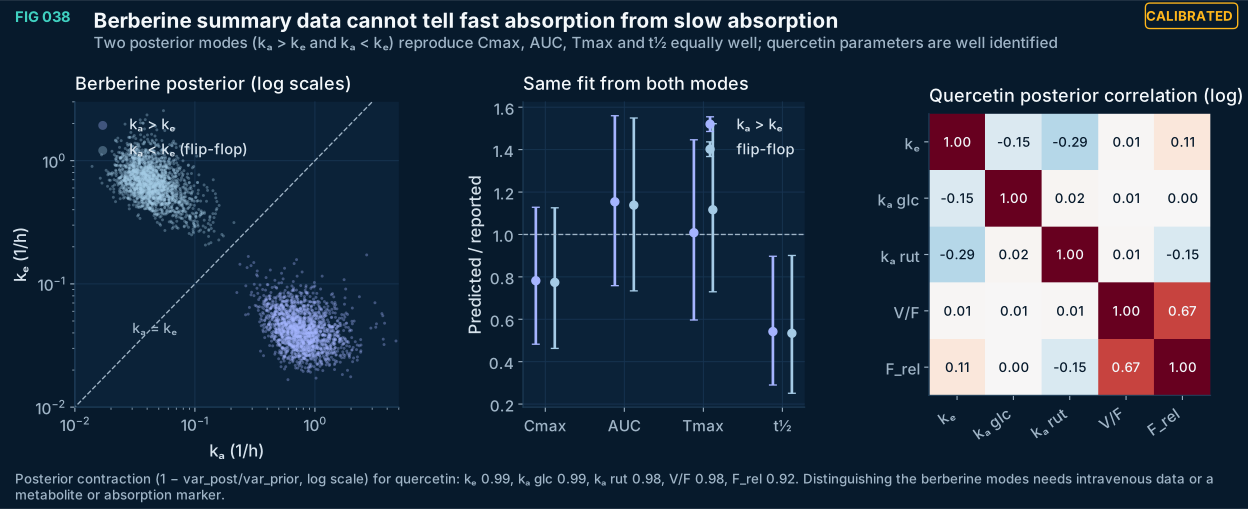
FIG 038Calibrated
Flip-flop non-identifiability of berberine absorption and elimination, and the posterior correlation structure of the quercetin model.
Method, sources and limits
- Method
- Two constrained fits (kₐ > kₑ, kₐ < kₑ); Pearson correlation of log posterior draws; contraction relative to the prior.
- Sources and code
- Data: Li G, Zhao M, Qiu F, Sun Y, Zhao L. Pharmacokinetic interactions and tolerability of berberine chloride with simvastatin and fenofibrate: an open-label, randomized, parallel study in healthy Chinese subjects. Drug Des Devel Ther 2019;13:129–139. doi:10.2147/DDDT.S185487 (berberine 300 mg single dose, n = 12, Table 6).; Data: Graefe et al., J Clin Pharmacol 2001;41:492–499 (n = 12 crossover).
- Supports
- Oral summary data alone cannot establish the rate-limiting step of berberine disposition.
- Does not support
- Any mechanism of berberine absorption or elimination.
- Limitations
- Prior-dependent contraction values.
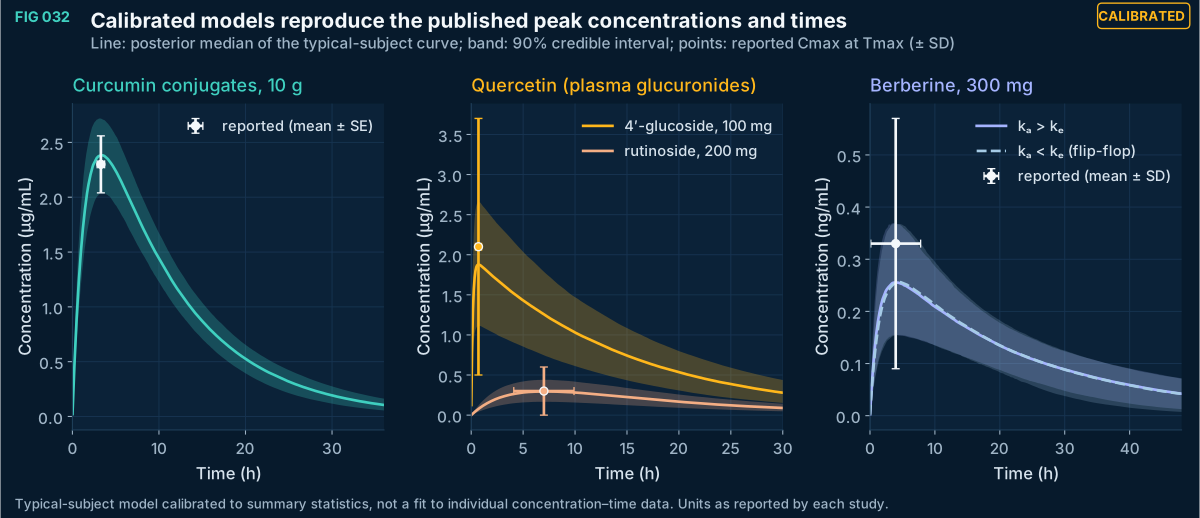
FIG 032Calibrated
Posterior median and 90% interval of the typical-subject concentration–time curve for each dataset, with the reported Cmax and Tmax.
Method, sources and limits
- Method
- PyMC 6.4 NUTS, 4 chains × 2,000 draws after 2,000 tuning steps; likelihood on reported summary statistics (SE = SD/√n).
- Sources and code
- Data: Vareed et al., Cancer Epidemiol Biomarkers Prev 2008;17:1411–1417; iScience 2025;28:112575.; Data: Graefe et al., J Clin Pharmacol 2001;41:492–499 (n = 12 crossover).; Data: Li G, Zhao M, Qiu F, Sun Y, Zhao L. Pharmacokinetic interactions and tolerability of berberine chloride with simvastatin and fenofibrate: an open-label, randomized, parallel study in healthy Chinese subjects. Drug Des Devel Ther 2019;13:129–139. doi:10.2147/DDDT.S185487 (berberine 300 mg single dose, n = 12, Table 6).
- Supports
- The model structures can reproduce the reported summary statistics.
- Does not support
- Any claim about individual subjects or untested formulations.
- Limitations
- Reported means of individual Cmax and Tmax are not the Cmax and Tmax of a mean curve (Jensen gap).
- Quercetin values are plasma glucuronides; no free quercetin was detected in that study.
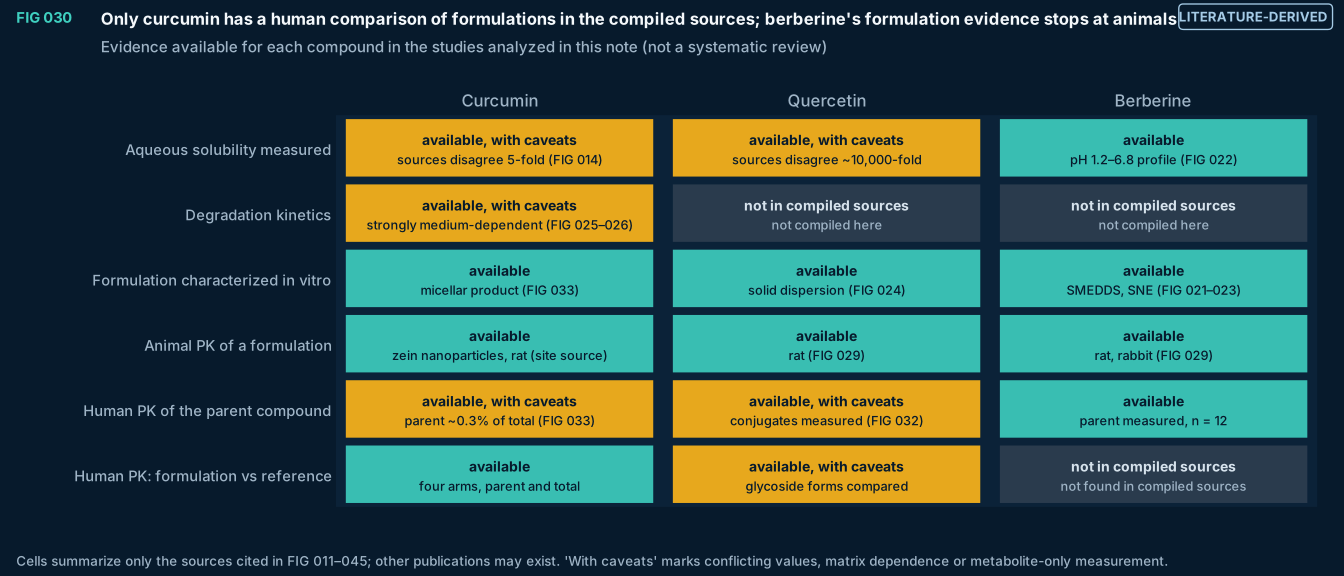
FIG 030Literature-derived
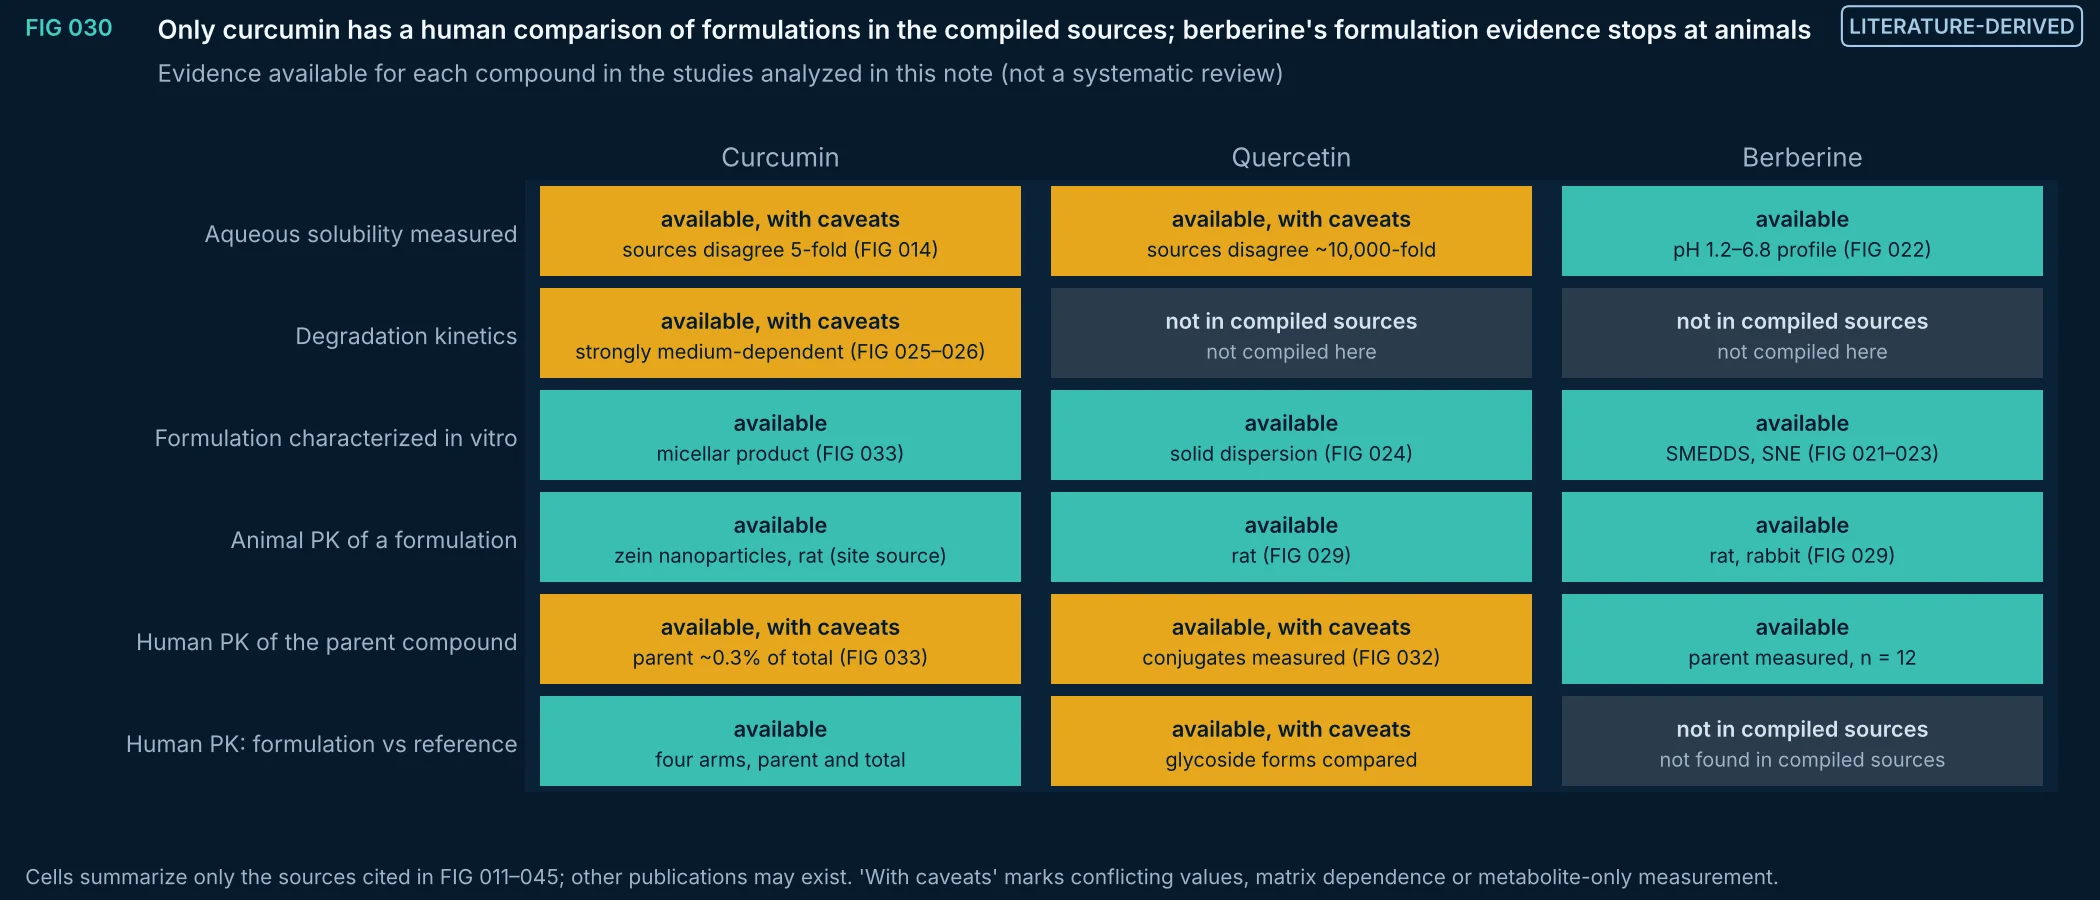
What the studies analyzed in this note do and do not show for each compound. Curcumin has a four-arm human study comparing formulations by unconjugated and total curcumin; quercetin's human data compare glycoside forms by conjugate levels; berberine has human data for the parent compound only, and its formulation data are in vitro and in animals.
Method, sources and limits
- Method
- Structured summary of the cited sources; categories defined before filling the table.
- Sources and code
- Sources as cited in FIG 011–045 and their metadata files. Script 05_delivery_QbD/form_figs.py; transcriptions in form_data.py; source XML in 00_provenance/literature.
- Supports
- Prioritizing human pharmacokinetic studies for berberine formulations.
- Does not support
- Any claim that a study does not exist.
- Limitations
- Not a systematic review; absence here means absence from the compiled sources only.
Interpretation
What the results support, and what they do not
Supported
- Remeasuring quercetin's water solubility and first pKa under controlled conditions before modeling.
- Treating glycoside form as a primary design variable for absorption rate.
Not supported
- Choosing either published water solubility for formulation design.
- Any human bioavailability claim for an aglycone formulation.
Next step and significance
What to measure next, and why it matters for development
- Next step
- Measure solubility at 25 and 37 °C with solid-form control and potentiometric pKa in a co-solvent series; then calibrate dissolution models against the measured values.
- Why it matters
- A formulation built on a solubility value that is wrong by orders of magnitude is likely to fail in scale-up or in the clinic. Settling these two numbers is inexpensive compared with the development work that depends on them.
Health information notice. These statements have not been evaluated by the Food and Drug Administration. Nothing on this site is intended to diagnose, treat, cure or prevent any disease, and nothing here is medical advice.
Read the full notice
The information is for general education only. It does not replace advice, diagnosis or treatment from a qualified health professional, or any medication a clinician has prescribed. Do not start, stop or change any medicine, supplement or herbal product because of something you read here. Talk to your doctor or pharmacist first, especially if you are pregnant or breastfeeding, have a medical condition, take any medicines, are preparing for surgery, or are caring for a child. Research findings, traditional uses and safety data are reported as their sources state them; they are not recommendations or claims about any product. If you think you may have a medical emergency, call your doctor or 911 at once.
EUTECNIQ Sciences sells no supplements or health products today and receives nothing from any product or ingredient mentioned on this site; any commercial interest it later has in an ingredient will be stated on that ingredient’s page.